Adapted from an activity created by Daniel R. Brooks, Deborah A. McLennan, Joseph P. Carney Michael D. Dennison, and Corey A. Goldman, Department of Zoology University of Toronto Toronto, Ontario M5S 1A1.
Introduction
One of the most profound implications of Darwin’s Theory of Evolution was that all life on this planet can be traced back to a common origin. This means there is one tree of life. Reconstructing the tree of life has proved difficult, and although we will never resolve it completely, in the last several decades there have been advances in many fields which have greatly enhanced our view of the history of life.
By this point in your education in the field of biology, you will have noticed that taxa share some characteristics in common and differ in others. Is there a pattern to these similarities and differences? We can use the features of present-day vertebrates to postulate their evolutionary history, given the key assumption that if two taxa share a given characteristic, they inherited the character from a common ancestor somewhere in the past, before the two present taxa speciated and evolved differences in other characteristics. The principle of parsimony suggests that the more new characters that are shared by two taxa, the more closely related they are.
Your objective in this lab is to assume the role of a taxonomist, and construct a hypothesis for the evolution of the land vertebrates: amphibians, birds, mammals, crocodiles, lizards, snakes, and turtles.. You have an array of bones from different tetrapods in front of you, as well as information about their urogenital and digestive systems. You will analyze information derived from these “specimens” to construct a genealogy of the organisms in the form of a branching tree. The pattern of the branching will depend on the characters that are shared among taxa.
Perhaps the most common phrase used to describe evolution is “descent with modification.” Descent entails an ancestor and its descendants: a genealogy. Modification involves a change in a characteristic or attribute in the descendant relative to the ancestor. Genealogical relationships among taxa cannot be directly observed. However, characteristics of living (or fossilized, when available) descendants can be observed. Since not all characters change at the same rate or to the same degree, descendants will be mosaics of unmodified (ancestral) and modified (descendant or derived) character states. It is the derived character states that you will identify and use to reconstruct the ancestor-descendant relationships, or phylogeny, of the tetrapods.
There are four basic steps in constructing a family tree:
- Identify homologous characters.
- Outgroup comparison: determine the order and polarity of the characters.
- Code the characters and construct a matrix.
- Group by synapomorphies: analyze the matrix to produce a phylogenetic hypothesis.
Homologous Characters
A character is an observable trait of an organism. It may be morphological, physiological, behaviourial, molecular, or ecological. A character may be passed on from an ancestor to its descendant either in unmodified or in some modified character state. For instance, if the character is eye colour, then character states might be brown eyes and blue eyes. If your parents have brown eyes which is the ancestral state, and you have blue eyes, then you have the derived character state.
Characters used for analysis must be homologous. Homologous characters in two or more species are derived from the same structure in a common ancestor. This definition presents a problem, since we would need to have some estimate of relationships in order to determine homology. If we then attempt to determine relationships among taxa using characters whose homology has been determined by reference to some estimate of phylogeny we will be confounded in a endlessly circular argument. In order to avoid this circularity, we recognize homology by developmental, structural, or positional similarity. If it looks the same and is found in the same place then we will assume it is homologous.
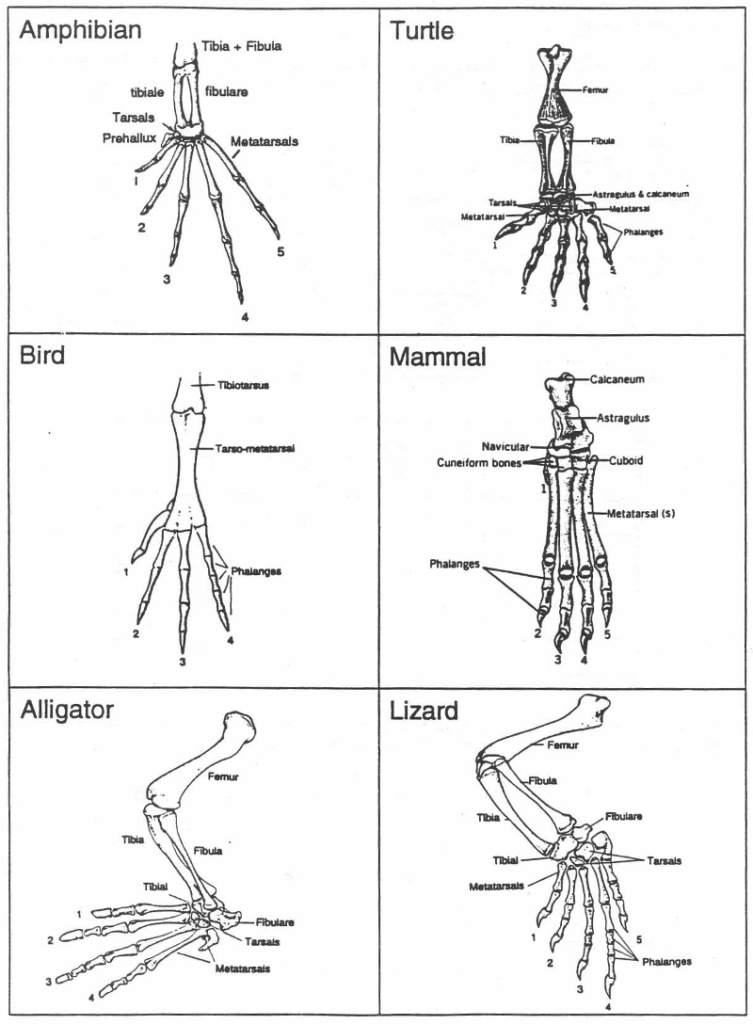
An example of homology is the vertebrate forelimb. The basic forelimb plan is retained throughout the vertebrates: there is a humerus, a radius and ulna, carpals, metacarpals, and digits comprising phalanges. However, there is variation among taxa in the exact morphology; frogs have one lower arm bone since the radius and ulna are fused; birds have a carpometacarpus which consists of fused carpals and metacarpals. How do we know which bones are homologous? The answer is that studies have shown that the bones develop in the same way and in the same position in the different taxa. During early development in the frog, for example, both radius and ulna bones can be distinguished and only later on do they fuse to look like a single bone. A similar pattern has been found for bird forelimb development.
Types of Characters
Apomorphy (apo = derived, morphy = form): a new or descendant character state.
Synapomorphy (syn = with, shared): an apomorphy that is found in two or more taxa. Also known as a shared derived character. Synapomorphies are used to infer phylogenetic relationships, so phylogenetic reconstruction may be viewed as a search for synapomorphies. A character can be a synapomorphy for a group only if no other organisms outside the group under study have the same character state. For instance, the presence of feathers may be considered a synapomorphy for different species of birds.
Plesiomorphy (plesio = old): The ancestral character state .
Symplesiomorphy: a shared ancestral character state. These characters provide no information in resolving phylogenetic relationships. However, what is a symplesiomorphy at one level may become a synapomorphy at a higher level. For instance, the presence of feathers will provide no information if you are trying to reconstruct relationships among species of birds, because all birds have feathers of some form. However, if you are undertaking an analysis at the level of the tetrapods, then the presence of feathers becomes synapomorphic for birds. This illustrates an important point. What is derived at one level of analysis may be ancestral at another level of analysis, and vice versa.
Outgroup Comparison
Once you have identified potential characters for analysis, how do you determine which are plesiomorphic and which are synapomorphic? Several methods have been proposed to address this problem, with outgroup comparison being the system most commonly used.
Outgroup comparison works on the following two assumptions. The first is that the group being studied – the ingroup – is monophyletic (all members of the group share the same, most recent ancestor). Second, the outgroup, used to polarize characters, is not part of the ingroup. Based on these assumptions, any homologous character state found in the outgroup and in the ingroup is considered plesiomorphic for the ingroup. States found in the ingroup and not in the outgroup are considered synapomorphic for the ingroup. This technique works readily when there are just two states of a character and one is shared with the outgroup.
Functional Outgroups
What happens if there is no state shared between the outgroup and the ingroup, or, if there is more than one derived state (i.e., character states 1, 2,..) found in the ingroup? In this instance you create a tree based on the characters which can be polarized unambiguously. Once you have used these characters you will have resolved some of the relationships among the ingroup taxa. By using the character state found in the basal most members of the ingroup as the plesiomorphic condition, you may polarize the remaining characters to further resolve ingroup relationships. The technical term for this is “functional ingroup/functional outgroup analysis.”
After you have completed polarizing the characters, you will construct a data matrix. This is a summary of the character states found in each taxon. Typically, the ancestral state is coded “0” and derived states are coded “1”.
Some characters are not binary (i.e., present/absent) and instead exist in more than two different states. Such multistate characters may be coded using other numbers, but it is important to understand that a code of “1”, “2”, etc., used to represent the states in a multistate character does not necessarily imply a sequence of change for the character, only that there is more than one apomorphic state. There are several ways to deal with multistate characters. In this lab, you will use one technique, and it will be performed by hand. This technique is known as Hennigian argumentation, after its originator Willi Hennig., and it proceeds by consideration of one character at a time.
Classification
Once you have developed an hypothesis of phylogeny you can create a natural classification for the groups being analyzed. A natural classification is composed of only monophyletic groups.
Assessing Characters
The table shown below lists the major vertebrate groups, along with several characters that are exhibited by all groups. For each vertebrate group, use the information on this page to determine the trait exhibited . You will want to create your own table (Word and Excel are both good options). I have started you off by including the Amphibian traits.
| Taxa | Skull joint (1) | Hind digits (2) | Gizzard (3) | Bladder (4) | Waste type (5) | Metab- olism (6) | Egg (7) | Hemi- penis (8) | Quadrate fusion (9) | Temporal fenestrae (10) |
| Amphibian | 2 | 5 | no | yes | urea | ecto | no | no | yes | 0 |
| Mammal | ||||||||||
| Bird | ||||||||||
| Lizard | ||||||||||
| Snake | ||||||||||
| Turtle | ||||||||||
| Alligator |
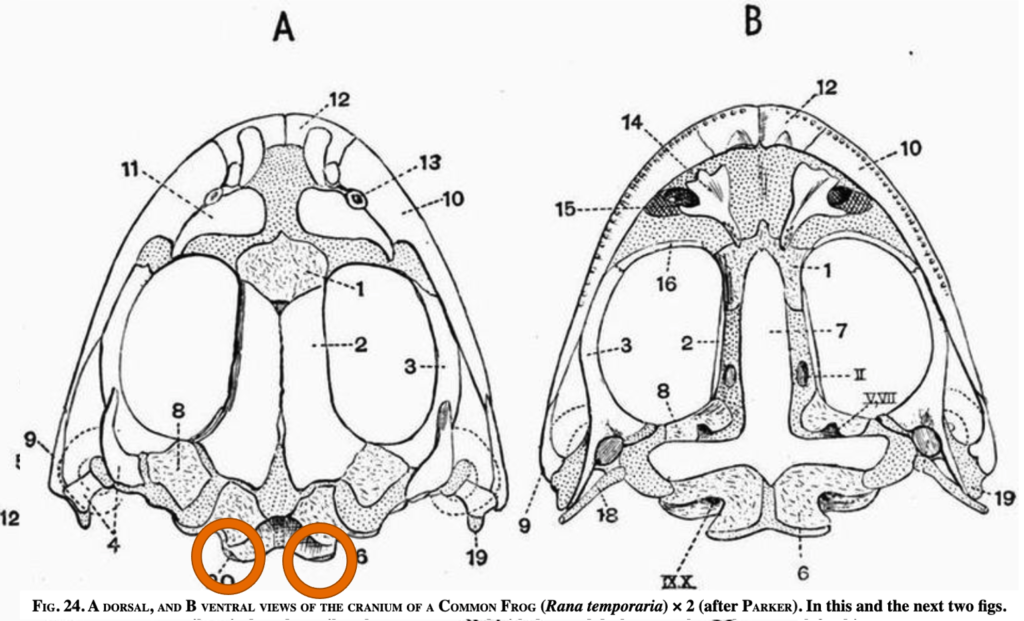
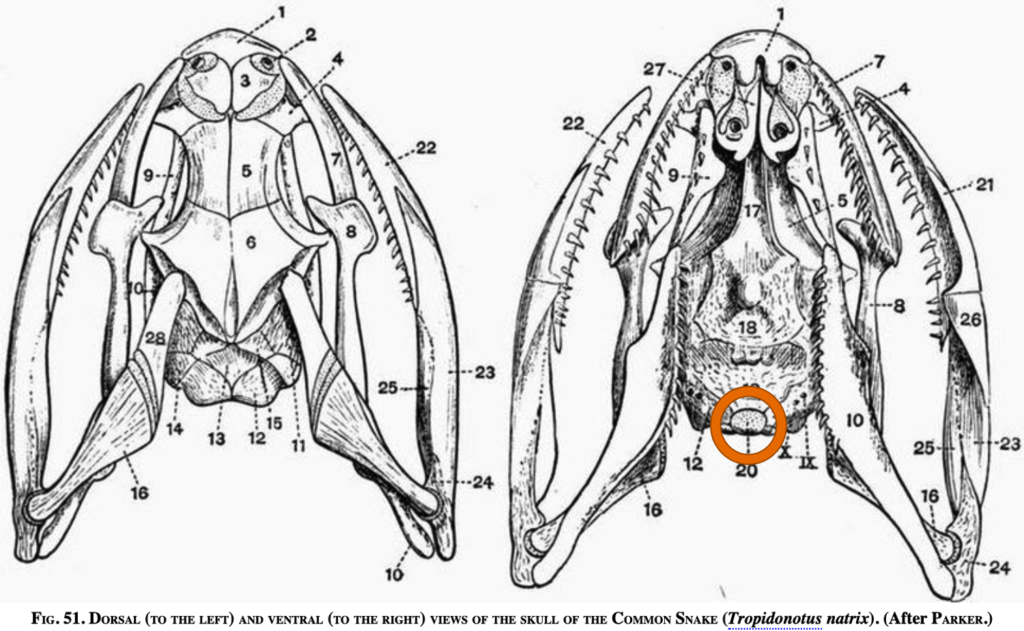
1. Occipital Condyle (Skull Joint)
Number of occipital condyles
Amphibian 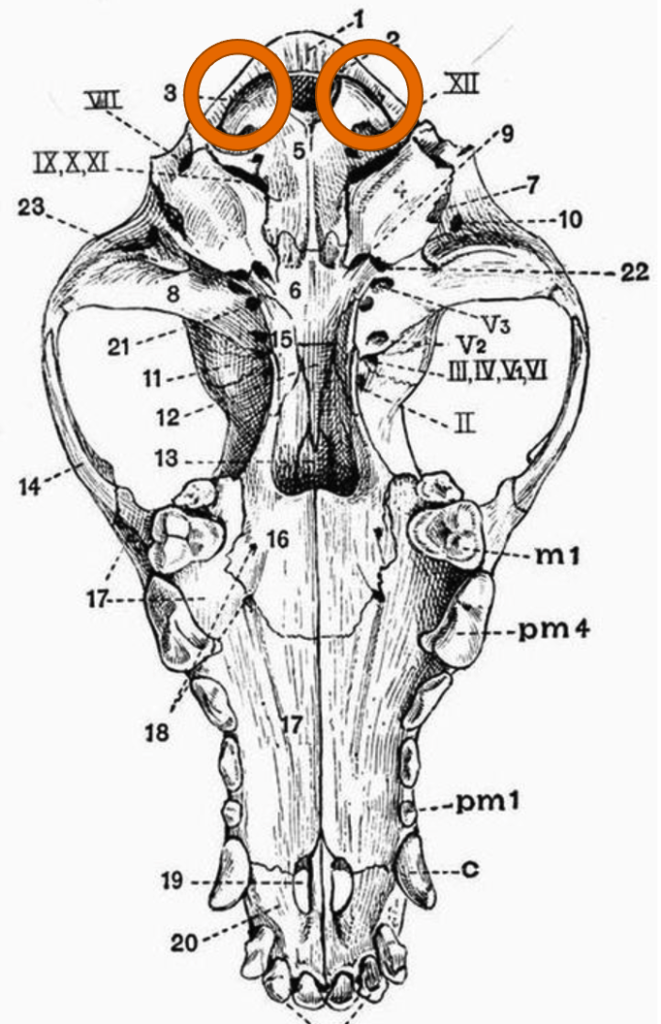
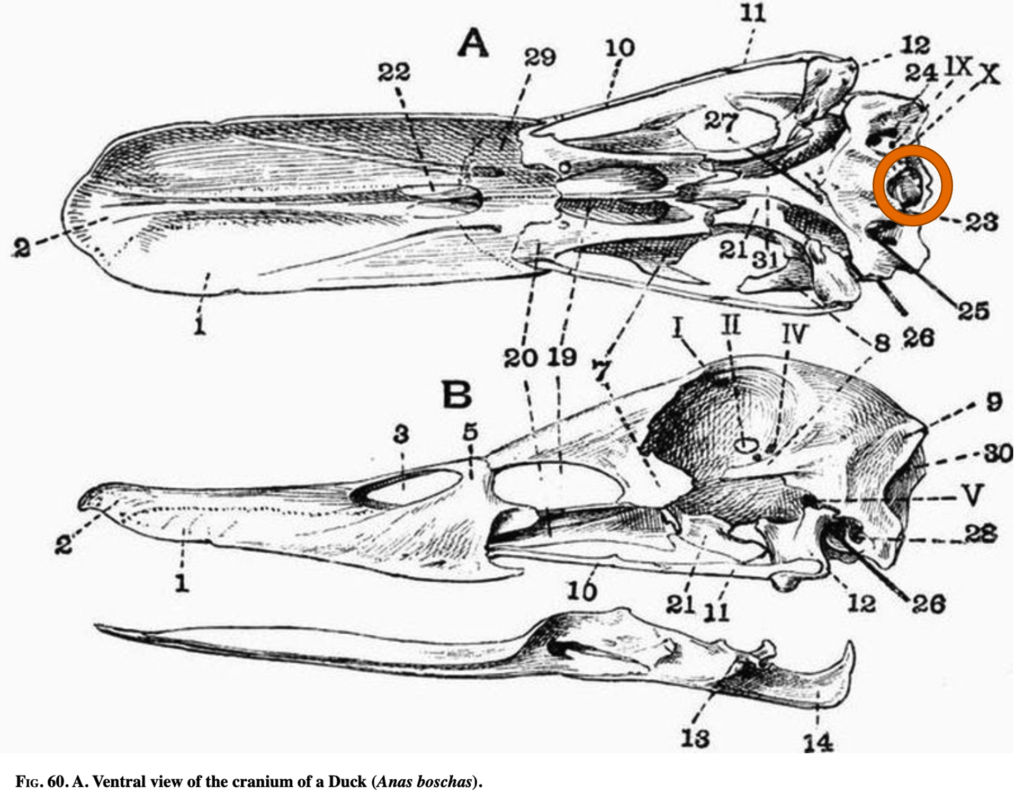
Bird 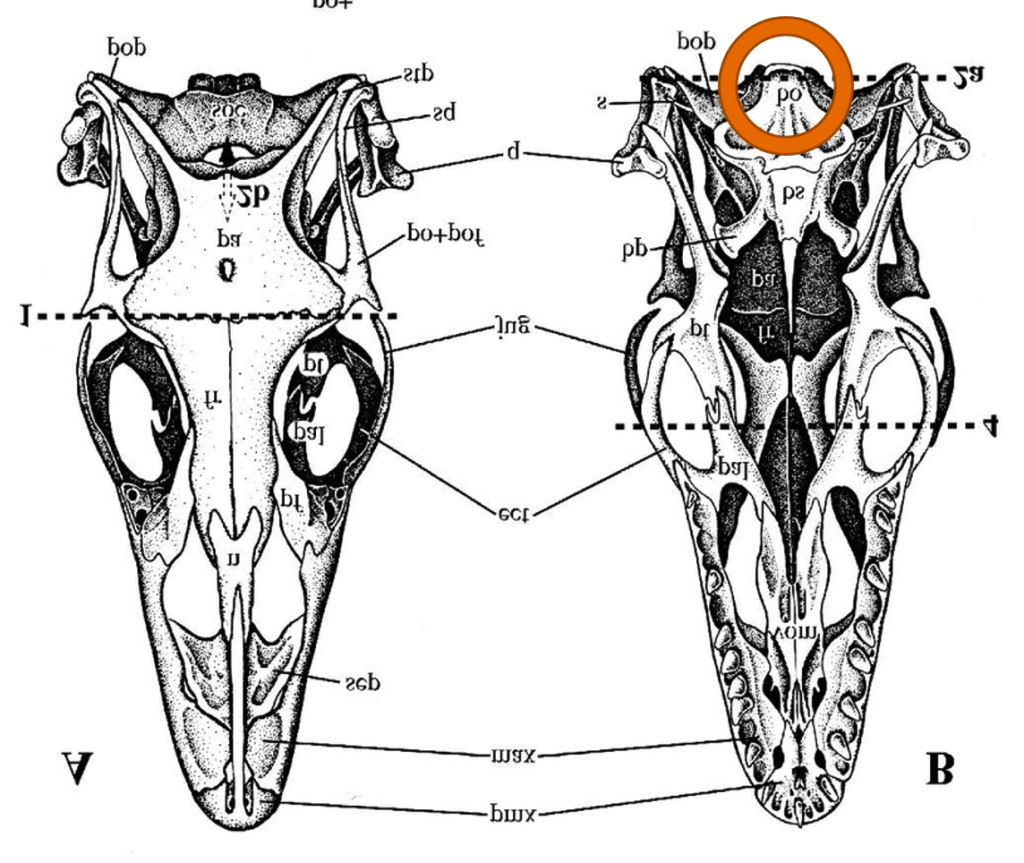
Snake 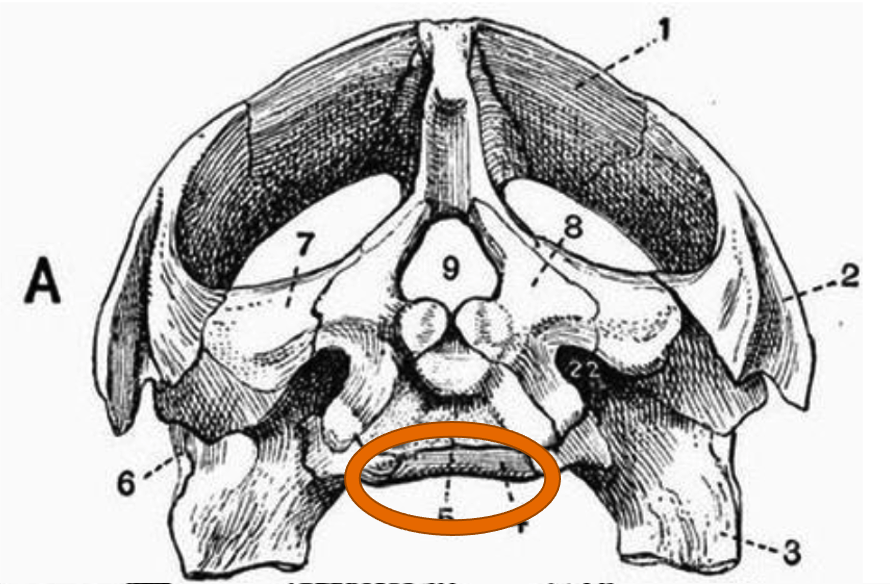
Turtle 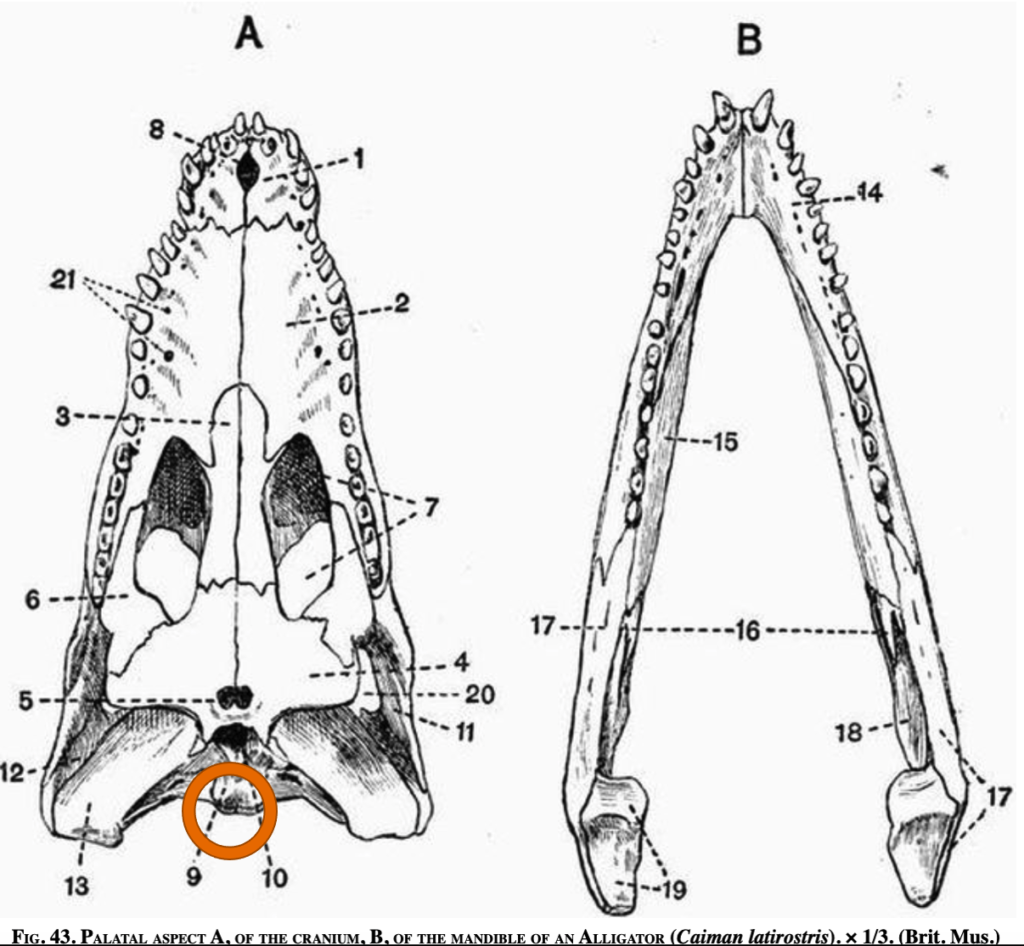
Alligator
2. Hind Limb Digits
Number of digits on one hind limb
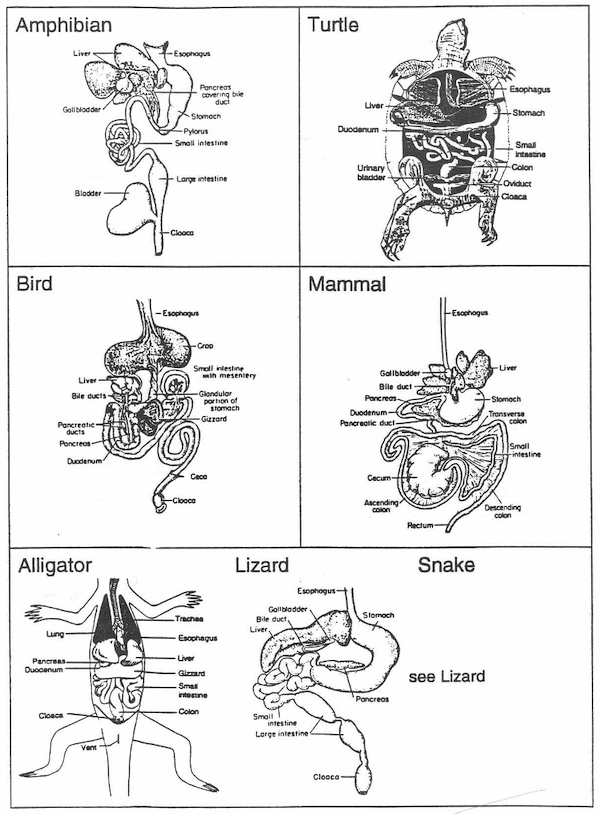
3. Gizzard & 4. Bladder
Presence or absence of a gizzard; presence or absence of a bladder
5. Temperature Regulation
Endothermic or ectothermic: you can easily find this information with a quick internet search.
6. Extraembryonic Membranes
Presence or absence of extraembryonic membranes. See lecture information from earlier today.
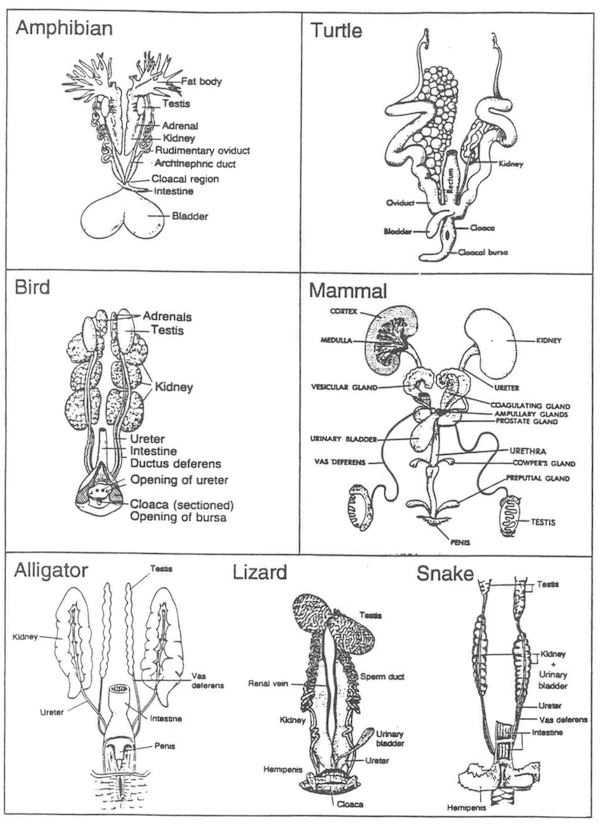
7. Intromittent Organ
Presence or absence of a hemi-pene
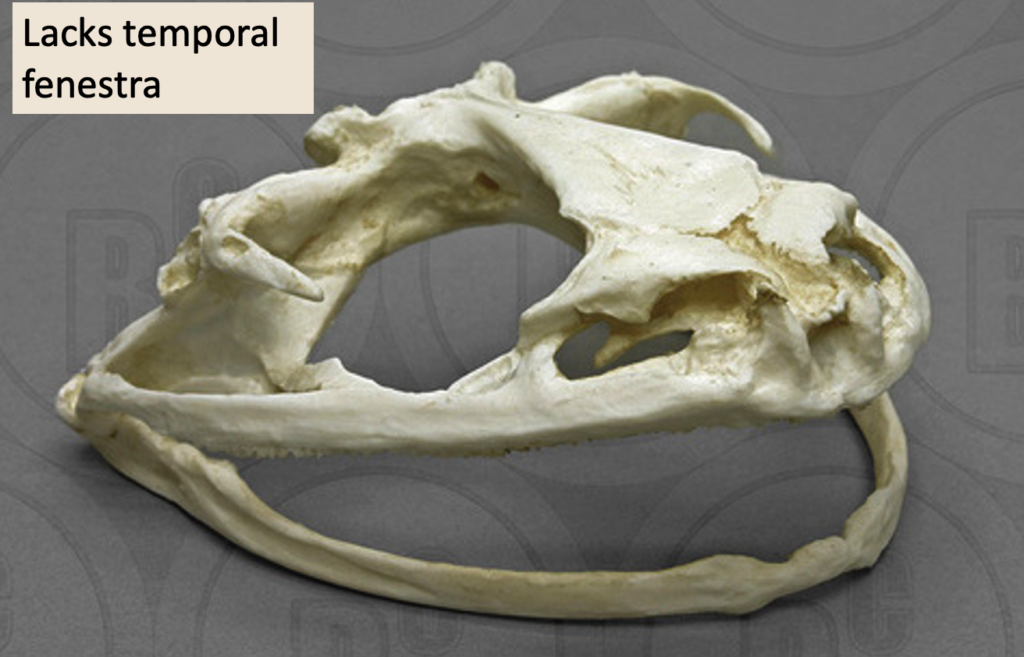
8. Temporal Fenestrae
Number of temporal fenestrae
Amphibian 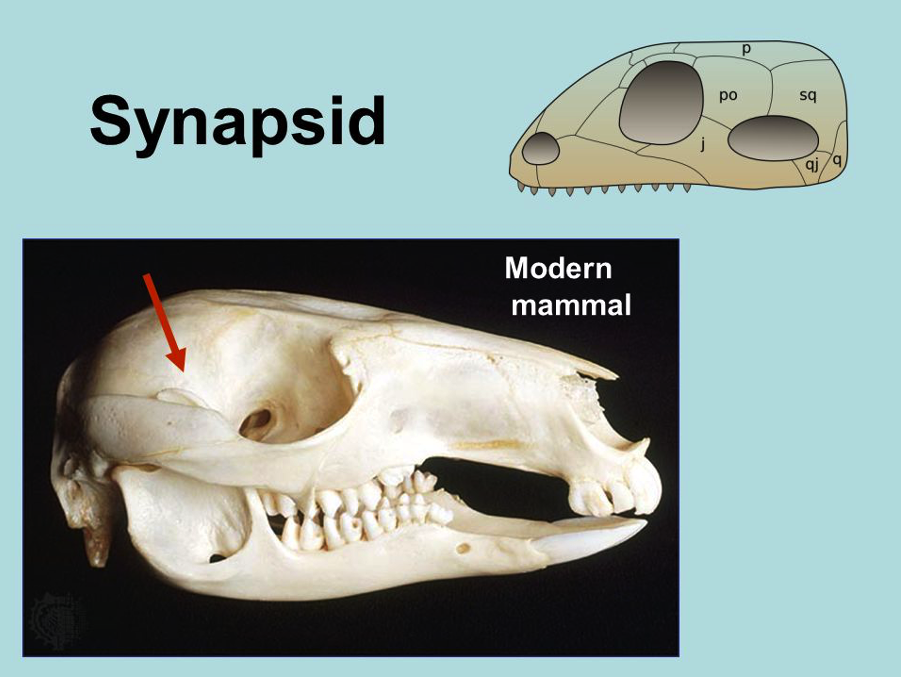
Mammal 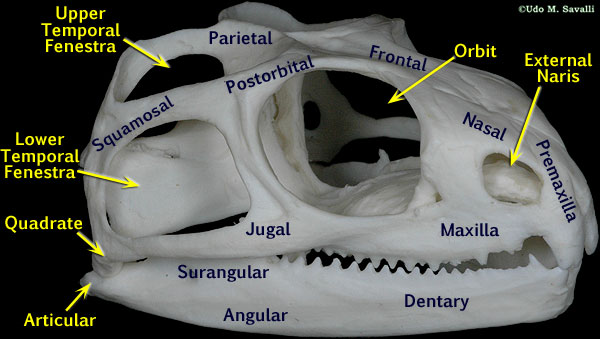
Tuatara (similar to Lizard) 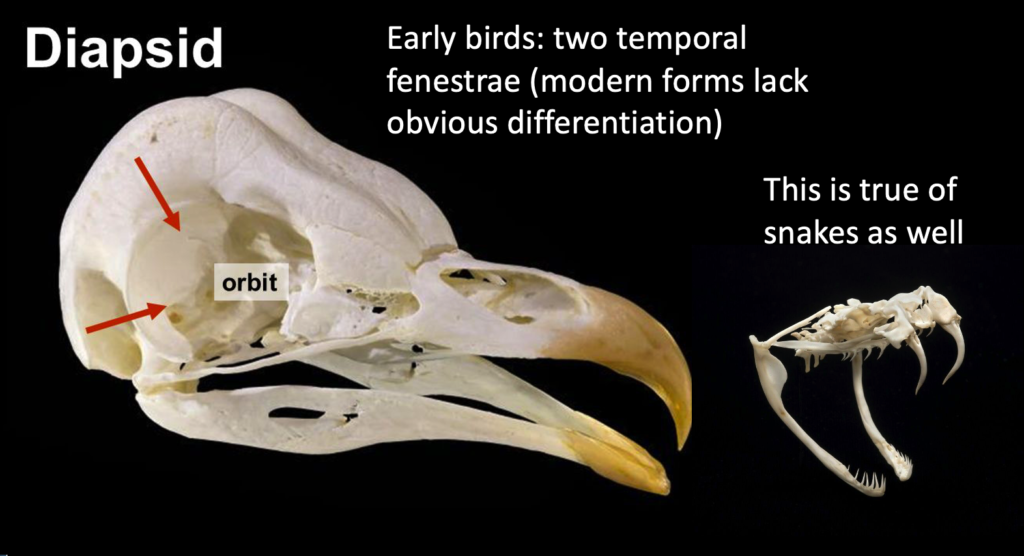
Bird and Snake 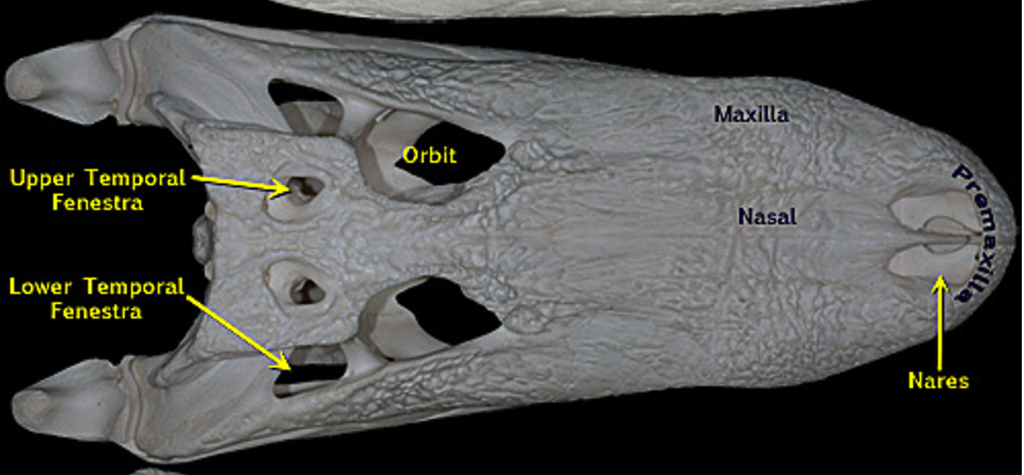
Alligator 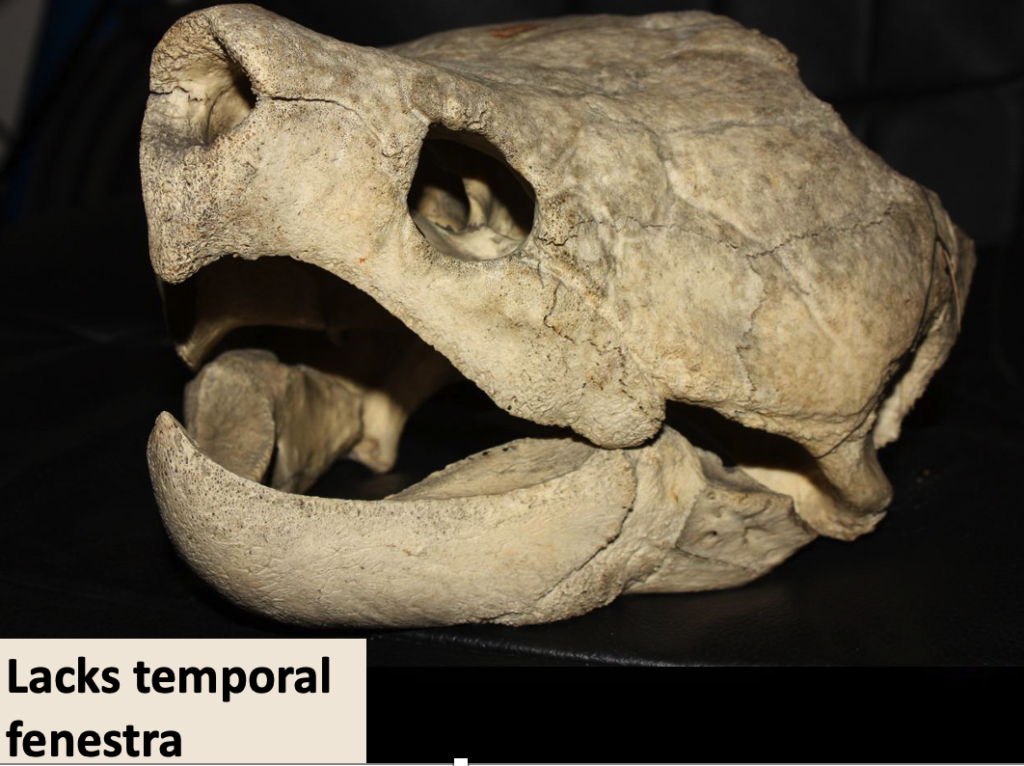
Turtle
Coding Traits
Create a new table where you will create a code to denote the traits exhibited for all our vertebrate groups.
- Determine the most appropriate outgroup. In this case, we can consider the traits exhibited by the outgroup as being ancestral, so you will assign them the value of “0.”
- What is an obvious difference between this outgroup and all the other groups under consideration?
- Compare each of the other vertebrate groups to the outgroup, for each of the assessed characters.
- If the traits are the same, assign a value of “0.”
- If the traits are different, assign a value of “1.”
- If there is more than one variation that differs from the ancestral state, you can assign additional numbers (“2,” “3,” etc) as needed.
3. Use these data to construct a phylogeny of amniotes. Your chart should be computer-generated (not handwritten or drawn). Make sure to refer to the characters/traits when creating your chart (rather than just creating the chart from your own memory/knowledge of these groups).