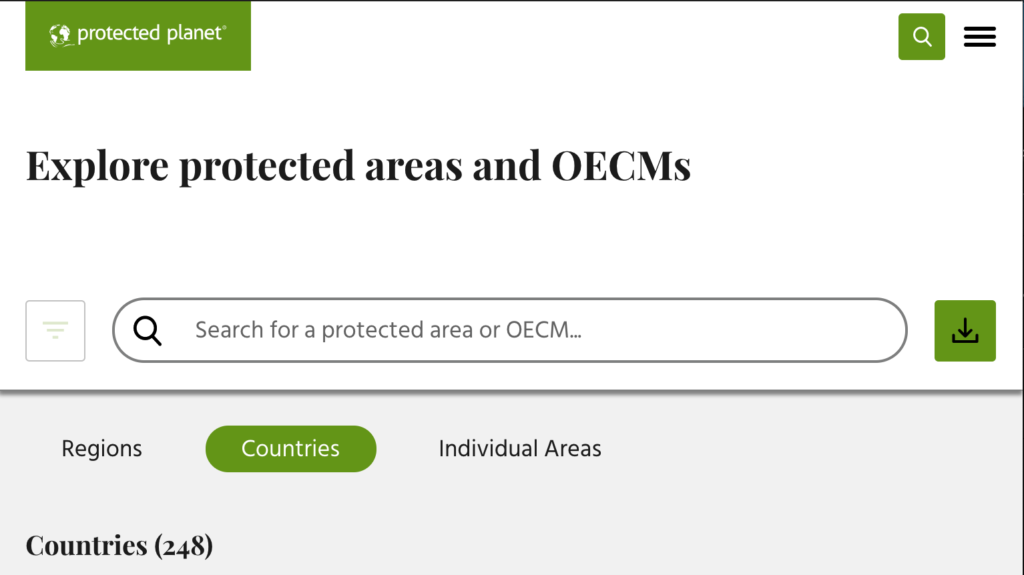
This semester, you will complete a project in which you compare and contrast the history of protected areas between two different countries.
1. Select Countries & Area of Focus
First, you will need to select two countries to compare and contrast. It is also permissible to compare and contrast two U.S. states, if you prefer. You will also need to decide whether you want to analyze just terrestrial protected lands, marine protected areas, or a combination of both. Here are some guidelines to help in your selection process:
- Since a main part of this assignment will be to write a 2,000 word report on your findings, I recommend that when you are selecting countries, you have in mind some concrete ideas about why it would be interesting to compare and contrast these two areas. You can be creative in how you choose these countries. Some possibilities (but you are not limited to these ideas):
- Two countries of approximately the same size, one that is highly developed vs. one in the developing world
- One country in the Northern Hemisphere vs. one in the Southern Hemisphere
- Marine Protected Areas in a U.S. state on the Pacific coast vs. a U.S. state on the Atlantic coast
- Terrestrial protected areas in a European country vs. a North American country
- Two different countries or states that you have personally visited, allowing you to add your own personal observations about the cultures of these two areas
- Each geographic area you evaluate (country or U.S. state) must have at least 30 individual protected areas of the type you are investigating
Next, based on what you already know about the geographic locations you have chosen, formulate a hypothesis about what you expect to find when you analyze your data.
Now, you will download data from the Protected Planet website: “Explore protected areas and OECMs“

- Navigate to the first country you have chosen (by searching, or scrolling down the page), and download the data as a .CSV file.
- You should also save the Citation text, as you will need this for your final written report.

Country page 
Save as CSV 
Select Non Commercial 
Download your file
- Double-click on the downloaded file to unzip it. This will reveal a folder with 7 files.

- Click on the file with the three-letter country code (in this case GBR). It should open in Microsoft Excel. If you do not have Excel, you can import it into Google Sheets, however, you will need access to a computer with Excel in order to complete the graphing part of this assignment. Once you have opened the file, use the “Save As” feature to save it in the Excel format (.xlsx).

File with .csv warning 
Save your file in the Excel format
- Follow the same procedure for your second country. If you are going to compare U.S. states, you will only need to download the single file for the United States.
2. Clean up Data
- Open the folder “Resources in English” (or other language if you prefer) to access “Summary_table_WDPA_WDOECM_attributes.pdf.” This file contains the explanations for the various columns (and their name codes). It will be very useful when you sit down to begin to get your head around these data.

- Rename the columns that you intend to use with descriptive names. At a minimum, you will need:
- Name of the protected area
- Designation in English
- Area in square kilometers (Marine, Terrestrial, or both)
- Year of enactment status
- Remove any columns that are redundant, or have data that you will not use.
- You may remove both of the “GIS” fields, the “Polygon” field, and any fields where “Not Applicable” is the only label given for any of the data in that column.
- NOTE: You may find additional categories useful in writing your report, so make sure you understand the data in each category before deleting any of them.
- Remove data that you will not need (hint: use the “Sort” function to more easily remove categories of data)
- If you are only planning to analyze marine areas, you will want to remove all terrestrial areas
- If you are only planning to analyze terrestrial areas, you will want to remove all marine areas
- Remove any rows that are missing dates
By the time we return from Spring Break, at a minimum you should have downloaded all of your data, and formatted it as above. If you would like to begin exploring your data, you will find information on how to proceed on the next page:
NEXT PAGE COMING SOON