To complete this assignment you will use the IUCN Red List database (as in Homework #1) to compare patterns of endangerment and threat for TWO nations of your choosing.
Pick a taxonomic group that is of interest to you. Then, for each nation:
- Choose 2 countries where species in your taxonomic group are known to exist.
- For each country, in the Excel sheet provided, record the total number of species in your taxonomic group that are present.
- For each country, record the total number of critically endangered (CR), endangered (EN), and vulnerable (VU) species for your taxonomic group.
- Record the number of CR, EN, and VU species affected by each of the major categories of threat, broken down by the specific threats in each category.
- Not all species will have listings for all categories, so you only need to list ones mentioned in the individual species articles for the specific data you are investigating.
- Present these data in a table formatted in Excel
- Entire table must fit on a single page, with high enough resolution that the text is clear with no obvious pixelation or distortion (using the “Print to PDF” function might be a good way to export your table from Excel)
- Format the data in a way that is clear and easy to understand
- Use color to highlight important information
- Your final table should be something appropriate for use in a presentation or on a poster
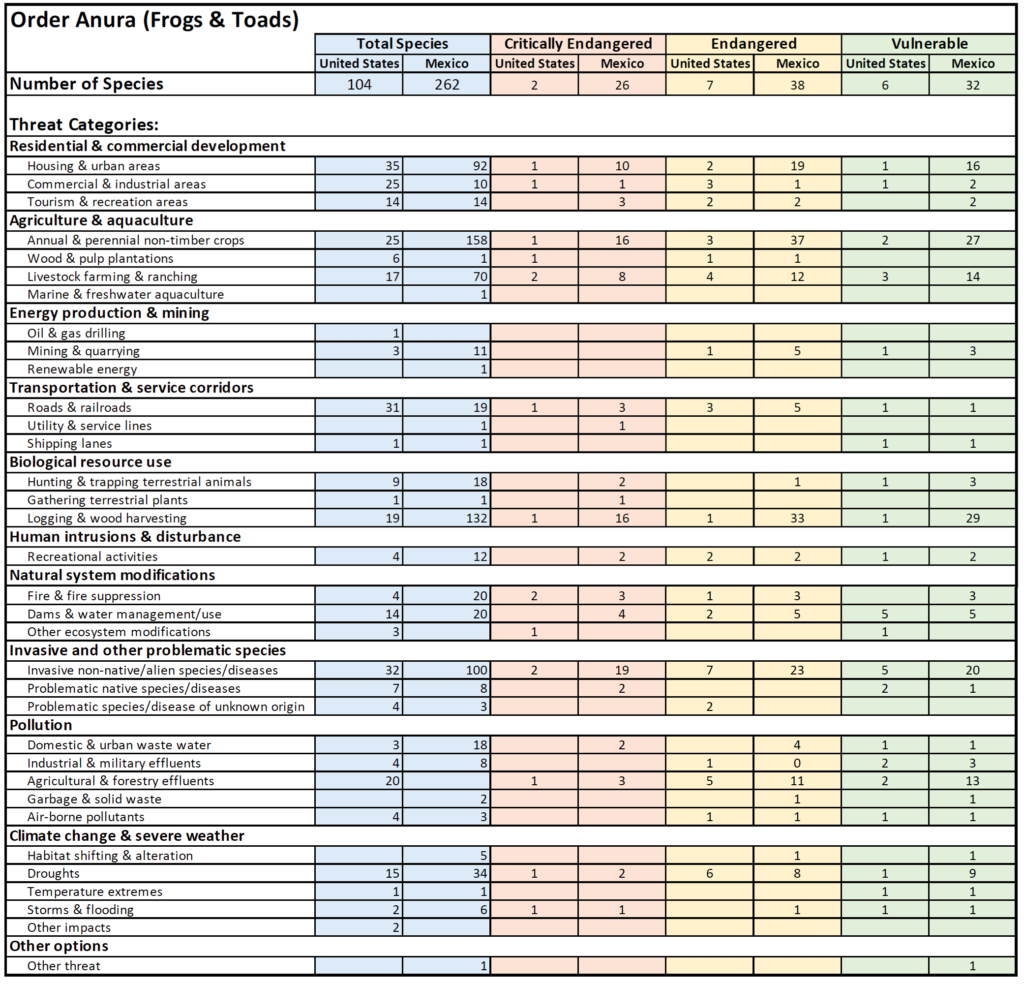
- See example below (this is just one possible way of formatting the data. Your chart does not have to be arranged in this same way, as long as the information is presented nicely).
Use the data to write a 1-page report comparing the patterns of endangerment and threat between the two countries. Think carefully before drawing conclusions. For example, if one of the countries has significantly more species, is this pattern due to differences in environmental policy, does one of the countries cover a much larger area than the other, or are the climates different enough to affect local biodiversity? Do any necessary outside research to support your conclusions.
Example
I chose the taxonomic group Anura (frogs and toads), and decided to compare the number of species between the United States and Mexico: