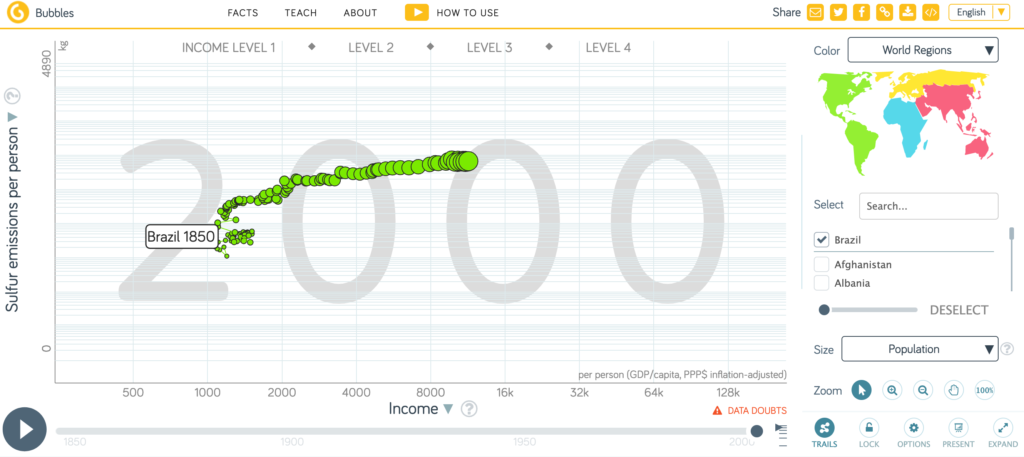
At the Gapminder website (https://www.gapminder.org/tools/):
- Locate data concerning yearly sulfur dioxide (yearly SO2 tonnes per person) emissions by nation, as well as income per person (GDP/capita,PPP$ inflation-adjusted).
- Plot one or more graphs that test whether or not the Kuznets curve hypothesis has empirical merit. (Hint: Gapminder will produce a graph for you if you click on the right buttons. Give yourself plenty of time to play around with the graphing tool. Alternately, you could download the data and create your graph in Excel).
- In a couple of paragraphs, discuss the graph(s) in conjunction with the hypothesis implied by the Kuznets curve. (Make sure you fully understand the hypothesis before attempting to make these connections).
Submit your graphs and discussion in a single PDF file.
Example graph for just a single country’s data: