Download the Excel table below. This contains the data you will need for this week’s activities:
Simpson and Shannon Calculations
In Excel, calculate the diversity of the Grassland Habitat. Refer to the video below for a walk-through of the Excel functions that can be used to calculate the Simpson’s D and Reciprocal, and Shannon’s H and ENS diversity indices.
Now, repeat this process with the other two habitat types (Beach and Forest). Lab Notebook: Include screenshots of the sheet with completed calculations for all habitat types. You will also include your responses to the following questions:
- How does the diversity of Pokemon encountered differ between the three habitat types?
- Does the actual number of species encountered differ from the D and/or H? If so, explain what this means, using the Grassland Habitat as an example.
- Which habitat type is the most diverse? Which is the least diverse? Explain your answer in terms of the diversity index calculations.
- How do the Simpson and Shannon results differ between the habitat types? Explain what this difference means for the Grassland Habitat.
Macroinvertebrate Simulation
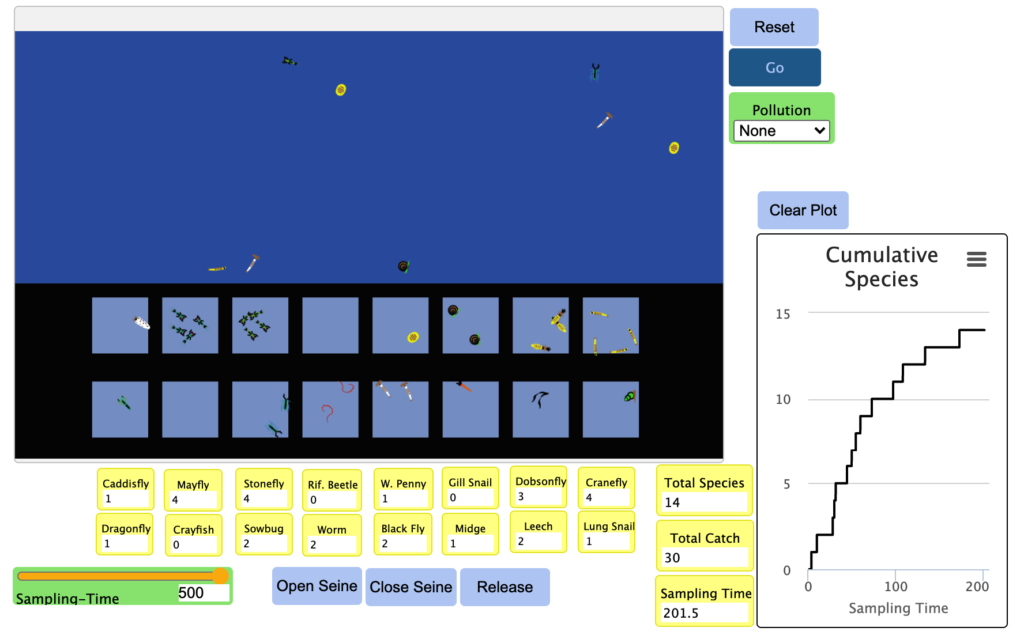
You will use the simulation linked below for an example of how freshwater macroinvertebrate communities might differ due to varying levels of pollution.
http://virtualbiologylab.org/NetWebHTML_FilesJan2016/StreamDiversityModel.html

You will run a total of three simulations, one at each pollution level.
- Create an Excel spreadsheet to keep track of your sampling data.
- Run the first simulation
- Make sure that “Pollution” is set to “Severe”
- Click “Reset” and “Clear Plot”
- If the model is not running (you will see organisms floating across the screen), click “Go.”
- When the model is running, click “Open Seine.”
- Allow the model to run for a “Sampling Time” of 200 seconds.
- After 200 seconds, click “Close Seine.” (It’s okay if you click a second or two after 200).
- Enter the data from the yellow table into your Excel Sheet
- Change “Pollution” to “Moderate,” and run the second simulation according to the instructions above
- Change “Pollution” to “None,” and run the second simulation according to the instructions above.
- BONUS CHALLENGE: rather than entering the Total Species and Total Catch values from the simulator, use the “COUNTIF” and “SUM” functions in Excel to calculate them directly in the spreadsheet.
Lab Notebook: Include screenshots of the simulation results for all three pollution levels.
Calculating Diversity
In the Excel sheet, you will calculate diversity using both the Shannon and Simpson diversity indices, as well as their respective effective number of species calculations. Refer to the video above to review the steps of these calculations.
Lab Notebook: Include a screenshot of your final Excel sheet showing all calculations. You will also include your answers to the following questions:
- How does the diversity of macroinvertebrates encountered differ between the three pollution levels?
- Which pollution level is the most diverse? Which is the least diverse? Explain your answer in terms of the diversity index calculations.
- Does the species composition differ between the different pollution types? Explain your answer in terms of pollution tolerance.
- How do the Simpson and Shannon results differ between the pollution levels? Explain what this difference means using examples from each pollution type.
Once you have completed the calculations with your simulated data, you will calculate the diversity of the actual Copeland Creek data provided by Professor St. John. Lab notebook: Answer the following questions:
- Based on the calculations you completed, did you see a difference in diversity across different years? Explain your answer with examples from each year.
- Based on the species that are present in Copeland Creek, what can you conclude about the pollution level of this waterway?
Pollution Tolerance
Using the technique described in lecture, calculate the water quality of Copeland Creek based on the 2018 BMI sampling data.
Lab Notebook: include a screenshot of your calculations. Follow-up question:
What can you conclude about the quality of water in the stretch of Copeland Creek that runs through the SSU campus? Explain your answer in terms of the pollution tolerance values in both 2017 and 2018.