Using the background knowledge you developed through the online tutorial, we will now explore some of the ways we can analyze our sensor dataset using Python.
Download the two files attached below, and move them into the Python application folder on your computer. Please note: You may be asked to authenticate these files with your computer password before they can be moved into the Python folder. This is normal.
Download from Google Drive: https://drive.google.com/file/d/1BwbI0rfcf8WT-0Tv-62GXI4NPv8AcVFD/view?usp=sharing
You will also need to download the worksheet:
Running Python Programs
- Locate the file title IDLE and open it. This just started Python.
- Within IDLE, go to the File menu, select Open, and open process_sensor_data.py. You will see some Python code written by CS professor Suzanne Rivoire. By the end of class you should have a basic feel for the code.
Key code commands are included in the Glossary from our first Python lab, for quick reference: Computational Skills III: Learning Python. Some useful operators are included in the table below.
| Operator | Some Useful Examples of using Operators |
| Assume string variable a holds ‘Hello’ and variable b holds ‘Python’, then: | |
| + | a + b will give HelloPython |
| * | a*2 will give -HelloHello |
| [] | a[1] will give e |
| [ : ] | a[1:4] will give ell |
| in | H in a will give 1 |
| not in | M not in a will give 1 |
| Operator | A way to compare values | Example |
| == | Checks if the value of two operands are equal or not, if yes then condition becomes true. | (a == b) is not true. |
| != | Checks if the value of two operands are equal or not, if values are not equal then condition becomes true. | (a != b) is true. |
| <> | Checks if the value of two operands are equal or not, if values are not equal then condition becomes true. | (a <> b) is true. This is similar to != operator. |
| > | Checks if the value of left operand is greater than the value of right operand, if yes then condition becomes true. | (a > b) is not true. |
| < | Checks if the value of left operand is less than the value of right operand, if yes then condition becomes true. | (a < b) is true. |
| >= | Checks if the value of left operand is greater than or equal to the value of right operand, if yes then condition becomes true. | (a >= b) is not true. |
| <= | Checks if the value of left operand is less than or equal to the value of right operand, if yes then condition becomes true. | (a <= b) is true. |
In the same window as the PYTHON program at the top you will see File, Edit, Format, Run, Options, Window, and Help.
- Go to the Run menu, and select Run Module. You will see the results of this action in the original IDLE window.
What happened when you tried to Run this program?
What is the significance of the printed result? Can you identify the lines in the code which would have returned this result?
- Remember the Comment function that uses hashtags (#) ? Insert a hashtag in front of this line of code, and then Run the program again:
print(“Number of Days is”, (number_of_days))
Describe what happened when you tried to Run the program.
Printing and Lists
- Referring to what we learned last week, write the code for a string named, “title” that prints the message, “Fairfield Osborn Sensor Data for May 2012.”
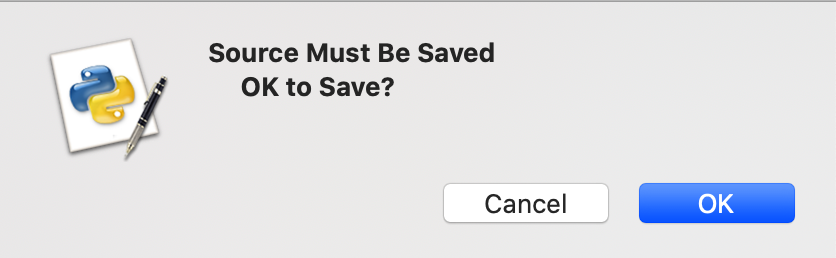
NOTE: Every time you have made a change to the code, you will need to save it before you can run the program. You don’t need initiative this save – you will be prompted to do it. Every time you see this message, just click “OK.”
- Add the following line to the end of your program, and run it again:
print(all_sensor_data[0])
Explain the data that were returned by this code.
- Now, create your own line of code to print out the second data point. Run the program.
Type in the data that was retrieved by this line of code.
- Open the csv file separately, and verify that the right data were retrieved.
- Now, use # to hide the print commands you have written up to this point, and then add this as the last line of your program:
print(all_sensor_data[0][5])
Explain what data was retrieved by using this code. Verify in the dataset that you are correct.
- Create your own line of code to print out the wind speed measurement from the SECOND data point.
What value was retrieved?
Loops
You can create a loop with an indent. This tells the program to continue running until a specified condition is met.
- Add the following lines to your program, run it, and try to figure out what it just did. The code lines should be indented exactly as they are here (with 4 spaces in the second line):
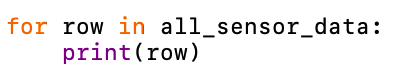
What data were retrieved by this code?
- Now modify it as shown below and run it:
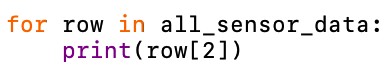
Explain the data that was retrieved by this code.
What is signified by the brackets?
Comparing Values
Printing all of the points is annoying – let’s be more selective about what we print. We’ll start out by printing only the samples that recorded rainfall. Since the rainfall is the 10th item in the row, we use an index of [9] to pick it out of the row data. Then, we’ll create a loop that will ask at each step if there is rain for that row. If so, it will print out the value. Type in this code exactly as shown (with each level of indentation being exactly 4 spaces), and run it:

According to this retrieval, how many incidents of rain took place during this sample period?
Do the data that were retrieved seem right based on our original purpose with writing this code?
- Remember the weird temperature anomaly we discovered in this data last week? Modify the code above to retrieve the data point that contains this negative temperature.
On what date and time did this anomaly occur?
One way that wind speed can be categorized is with the Beaufort Scale.
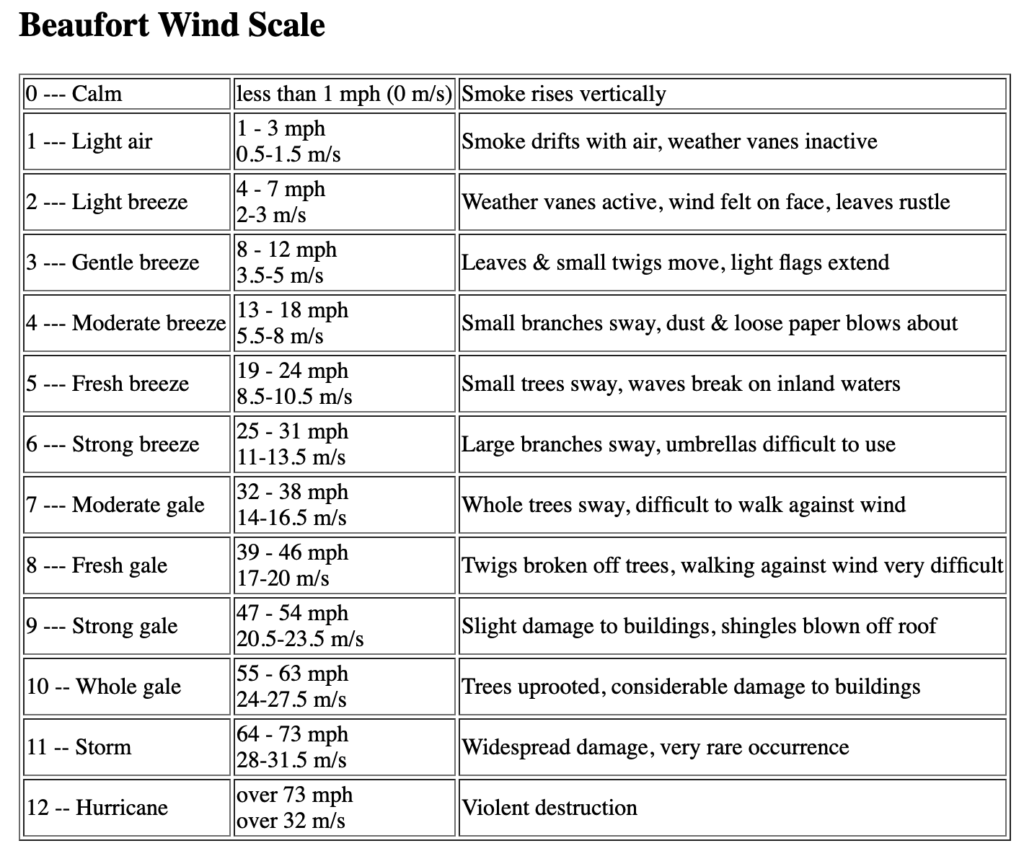
- Based on the Beaufort Scale, can you write a code that will return the data points for all windspeeds in the “Light breeze” category or higher?
Now, write code that will return the data points for all windspeeds in the “Gentle breeze” category or higher.
How many times was the windspeed in the Gentle Breeze category?
Counting
There are 3 parts to counting in a program:
- Create a variable to serve as your counter and set it to an initial value of 0
- Add 1 to it every time you want to increase the count
- Print the counter value
Here is an example that counts the number of samples where solar radiation (column 8) is zero:
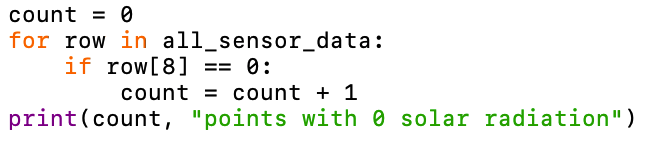
How many points had 0 solar radiation?
- Modify this example to count and print the number of points with recorded rainfall.
How many days had rainfall events?
Comparing to Previous Rows
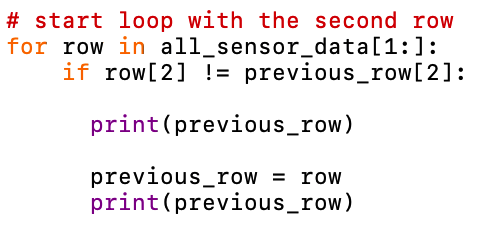
We can rewrite our loop so that it has access to the previous row and the current row. In order to do this, we will process the first row separately and start the loop with the second row. This example prints the last point of every day by looking for pairs of consecutive points where the days differ. Then we print the last point of the last day separately.
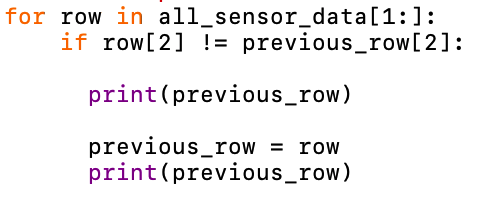
Now, let’s look at some of the existing code above the “GEP 202” line:
- Remove # as needed, so the code appears as follows:
- Run the code
What does this code retrieve?
Computations
Python will carry out mathematical functions for us with some simple additions to the code.
Run the following code that will perform a calculation with the data in the “Temperature” column:
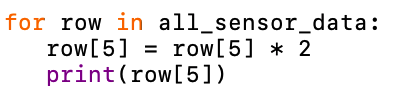
Explain what happened.
- Edit this code to convert the values in the “Temperature” column from Fahrenheit to Celsius.
Type your code into the worksheet.
Now, because is is STILL annoying to have an entire huge column of data print out, combine your conversion cod with this one, to print out only the Celsius temperatures for the last data point on each date.
Type your code into the worksheet.
The Zen of Python
For our final activity today, remove or # all your existing lines of code. Then, run this line of code:
import this
What part of this output makes the most sense to you right now?
(My favorite is “Now is better than never”).
After the in-class tutorial, you may refer to the information in this video for solutions to the problems: