Adapted from an activity developed by Mary E. Allen and Mark L. Kuhlmann
Food Chain Diagram
As we have seen, one way to visualize these relationships is with a diagram that shows the direction in which energy flows through the system, as the colored arrows do in the diagram pictured here. This can be described as the “bottom up” control of system, where resources limit the populations of organisms that are present. We can also use arrows to illustrate any “top down” control of the system that is driven by predators (the black arrows in the diagram at right).
In this activity, you will create a diagram using www.diagrams.net that illustrates both the bottom up energy flow, and the top down effect of otters on urchins and kelp.
When you create your diagram, use one style of arrows for the bottom-up energy flow, and another to represent the top-down control from predators. Do not close the file in diagrams.net, as we will add to it in a few minutes.
- According to the top-down theory, what is the effect of a loss of otters on sea urchin populations?
- What, in turn, is the effect on kelp?
Food Web Diagram
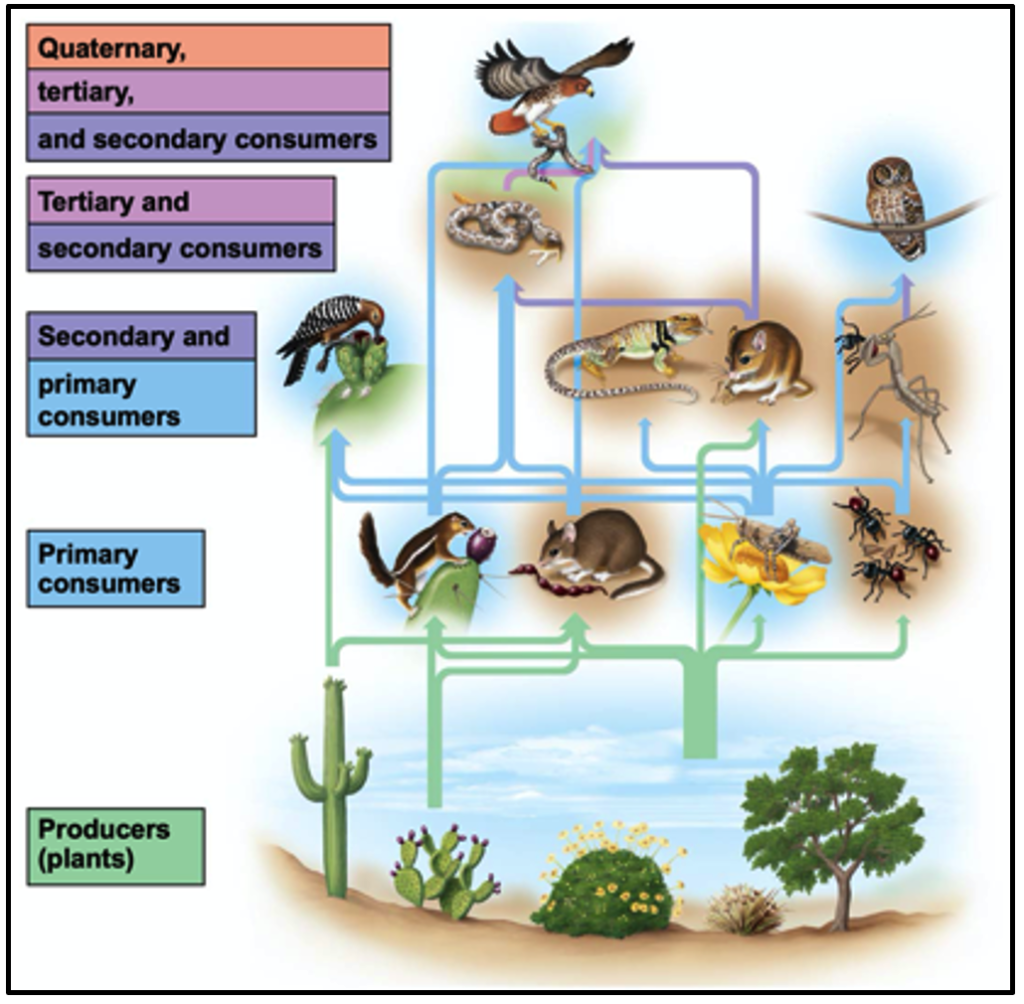
As we see in the Sonoran Desert example at pictured at right, by expanding this diagram to better describe the feeding relationships between a larger number of organisms in an ecosystem, a more detailed food web can be created. Here, the arrows indicate the flow of energy.
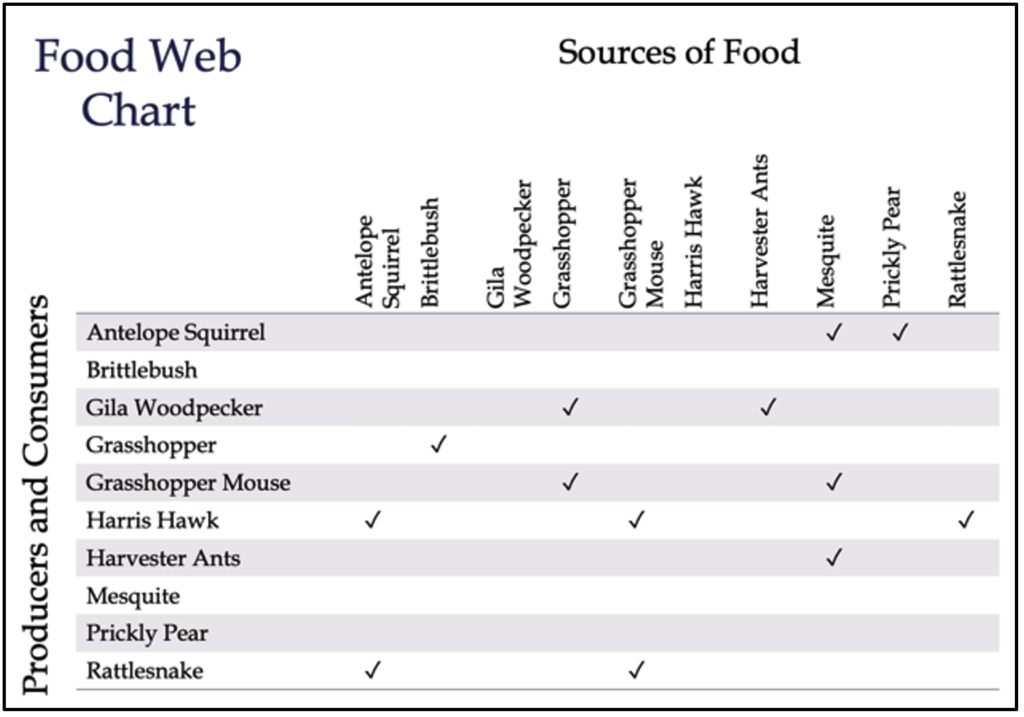
When we consider the various relationships in the ecosystem, we can construct a Food Web matrix that shows who is eating whom. (Note: the matrix pictured here is simplified and does not include all species pictured above).

Now, following the instructions below, you will expand your original Kelp Forest diagram to include several additional species in that ecosystem. Your final diagram should be similar to the one pictured here for the Sonoran Desert ecosystem.
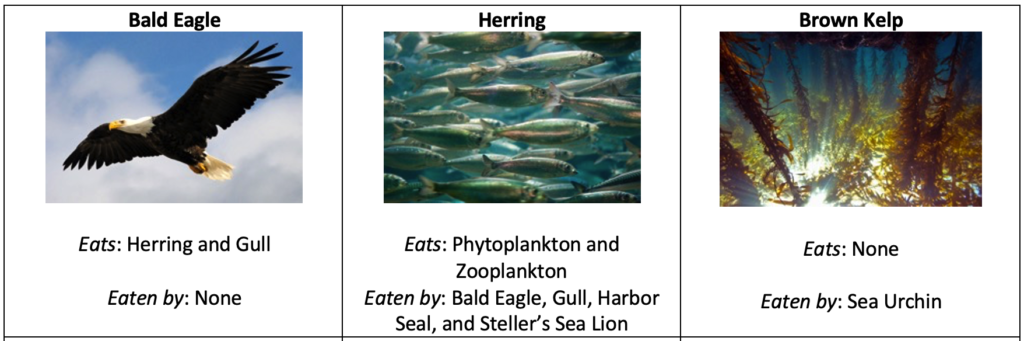
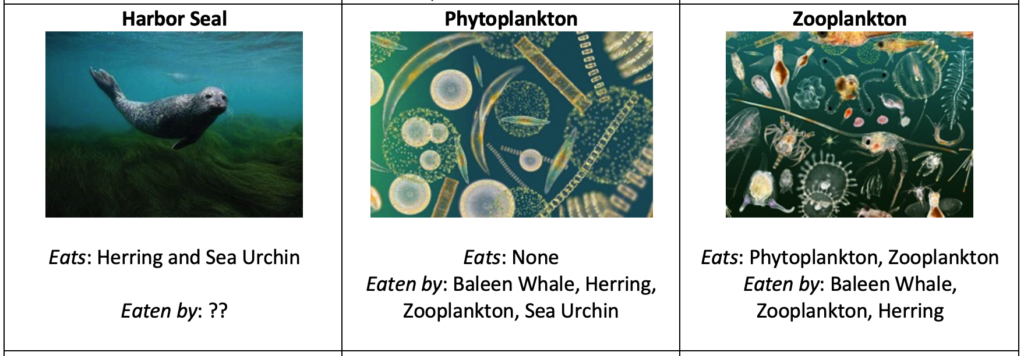
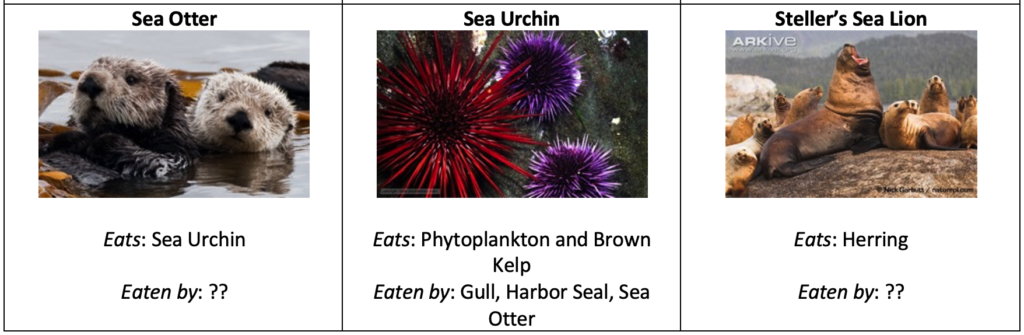
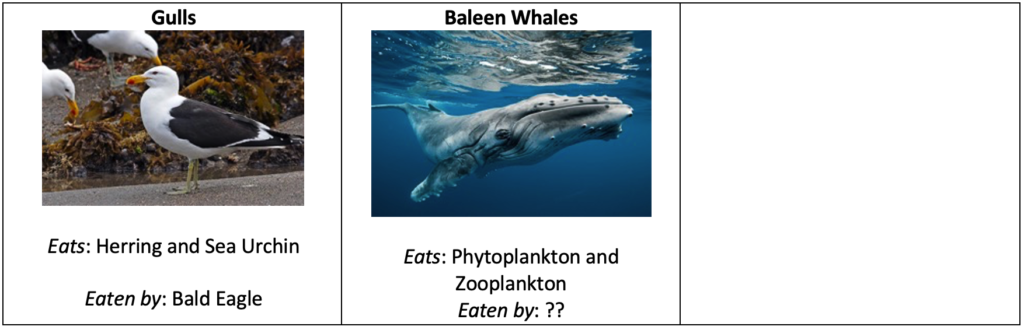
Begin by using these species “cards” to fill in the blank matrix in your worksheet.
- Who are the producers in this system? How can you tell by looking at the matrix?
- Who are the top predators in this system? How can you tell by looking at the matrix?
- What is the difference between phytoplankton and zooplankton? Are they producers, or consumers?
Now, you will expand your diagram for the Kelp Forest Ecosystem, following the instructions below.
- Include two distinctive sets of arrows:
- One set to show the flow of energy through the system
- A second set that reflects the top-down pressures being exerted by the main players in the system: sea otters, sea urchins, and kelp.
- Draw the boxes in your chart according to the following color scheme:
- Green = producers
- Blue = primary consumers
- Purple = secondary consumer
- Red = tertiary or higher-level consumers
- Once you have completed this chart, put it aside for a few minutes. You will make a small adjustment to it before you upload it to Canvas.
An Ecological Detective Story

While sea otter populations were able to recover in many areas after receiving legal protections, in the 1990s they began to decline again in some areas, for reasons that weren’t readily apparent. Dr. James Estes, a marine ecologist with the U.S. Geological Survey, began to investigate this question, and found that on some Alaskan islands, otter numbers had plummeted by as much as 90 percent in fewer than 10 years. What factors could contribute to such a rapid change in the size of sea otter populations? Estes and his team set out to discover the culprit.
Two questions for discussion:
- Is it reasonable to spend federal tax dollars to support scientific research into the decline of otter populations?
- Are we wasting money on animals that are merely “cute and fuzzy,” or might the loss of sea otters be an indicator (or even a cause) of more widespread imbalanced of these marine ecosystems?
In this excerpt from a New York Times article, Estes offers some clues to which factors were probably not causing the recent declines in sea otters:
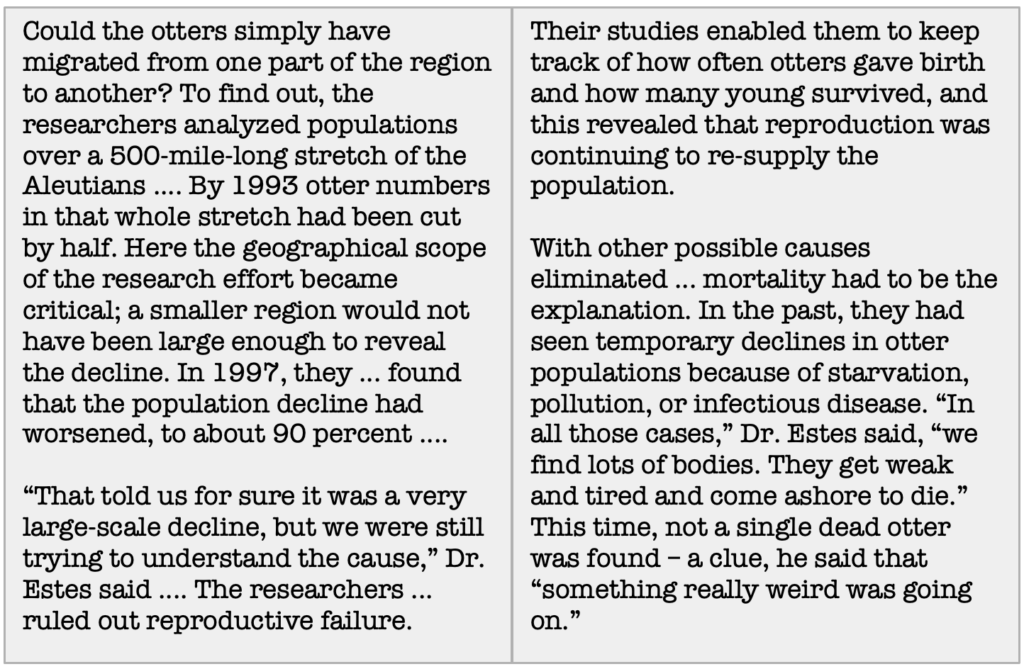
After ruling out several other factors, Estes and his group hypothesized that increased predation by orcas (Orcinus orca) was the cause of sea otter declines. This was an unusual idea, since orcas and sea otters had been observed together in Alaska for decades with no obvious interactions occurring between them. The first time an orca was observed attacking a sea otter took place in 1991. After nine more attacks observed in the next several years, Estes proposed his hypothesis. To test it, the scientists needed to have more information about orcas, and their relationship with otters.
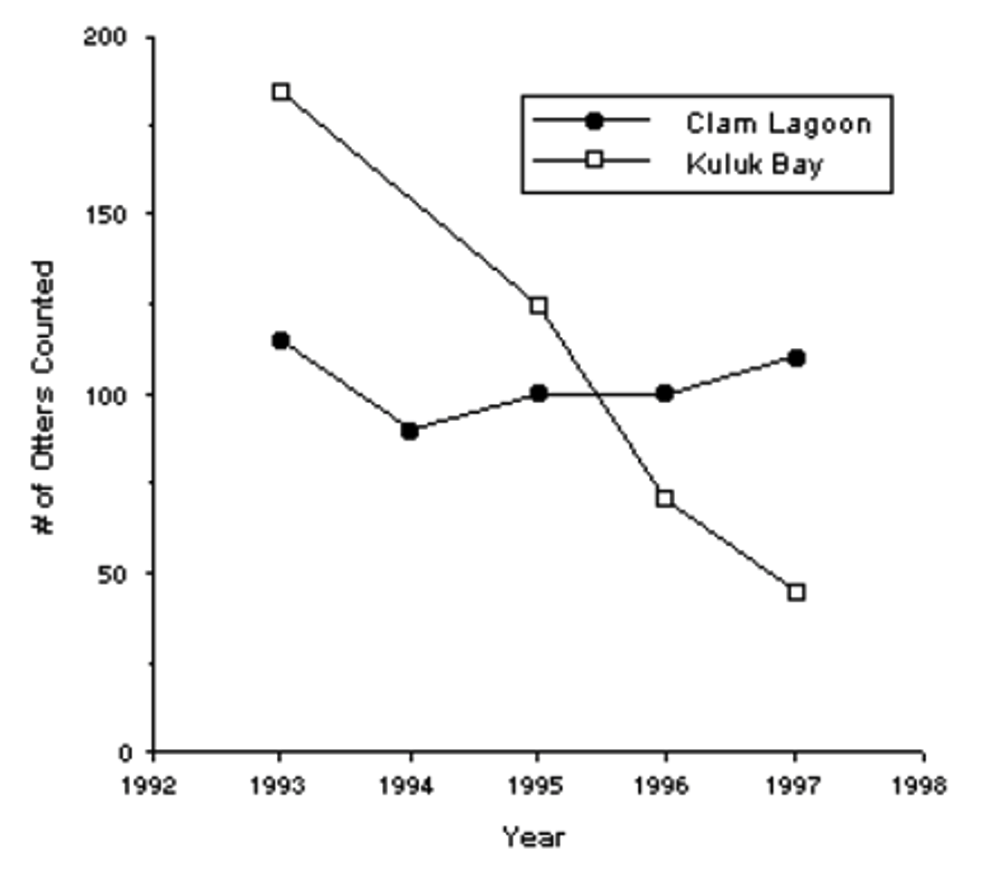
The research Estes and his colleagues performed estimated the impact of orcas on sea otter populations by comparing trends in population size and survival rates of individually marked otters between two adjacent locations on Adak Island: Clam Lagoon, and Kuluk Bay. Kuluk Bay is on an open coast, where sea otters are exposed to orcas. In Clam Lagoon, the entrance from the open sea is too narrow and shallow for orcas to pass through, affording protection to otter populations. Take a look at these results of their study:
Survival rates of sea otters individually marked with flipper tags and radio transmitters at Clam Lagoon and Kuluk Bay, Alaska, show that otters who lived in areas where orcas were excluded had better survival rates.
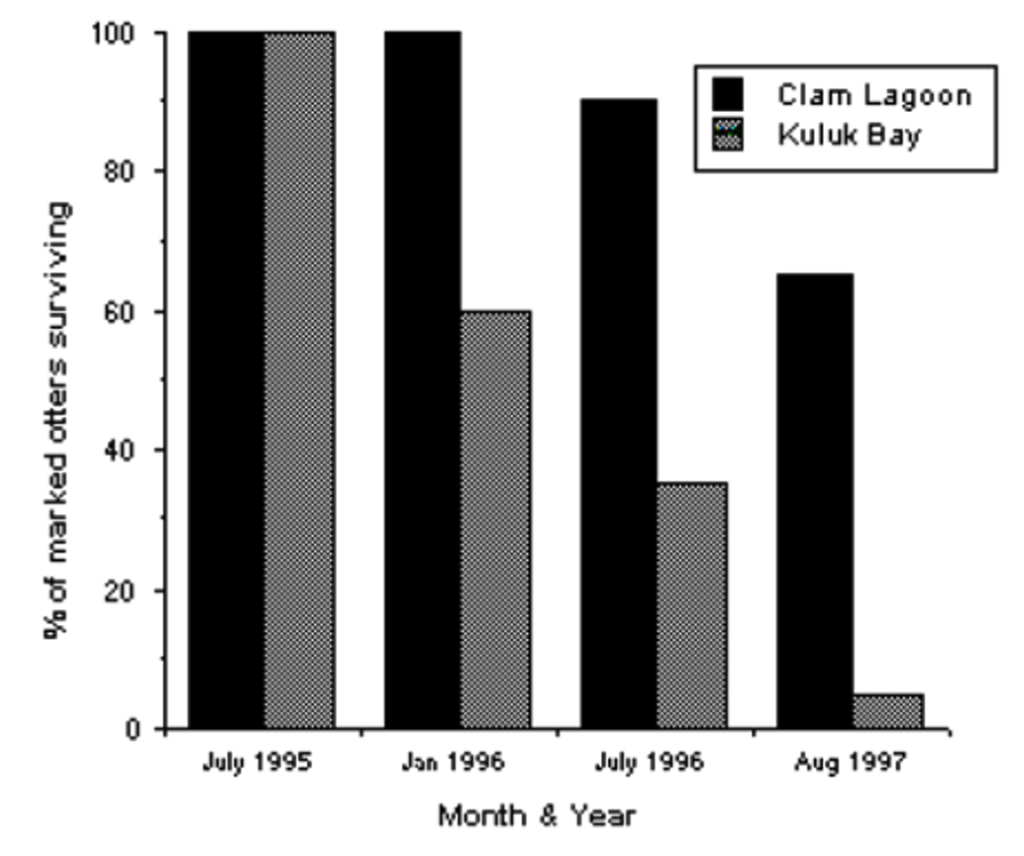
- In your own words, describe the findings show in this graph:
Evidence points to orcas as the cause of sea otter decline, but prior to the 1990s, orcas and sea otters appear to have co-existed peacefully for decades. What could cause orcas to start preying upon sea otters?
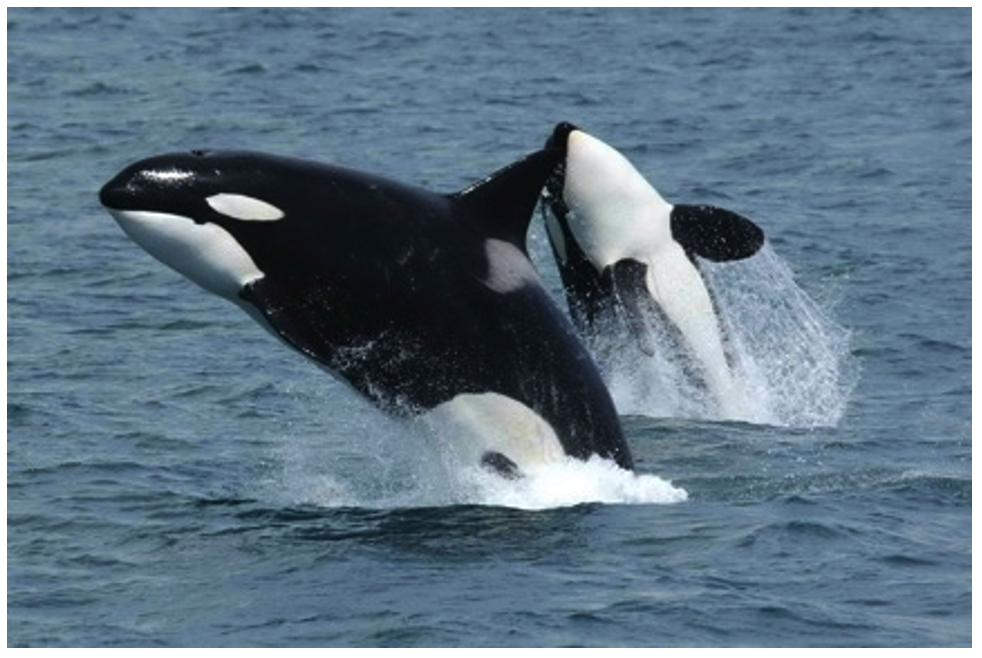
Orcas, also called killer whales, are the largest members of the dolphin family (Delphinidae). Their diets are enormously varied: they prey upon squid, fish, birds, sea turtles, seals, sea lion pups, and dolphins. Groups of orcas may also collectively hunt larger animals, such as the blue whale. Orcas live in groups called pods, which are of at least two genetically, morphologically, and behaviorally distinct types: transient populations, that roam over broad areas of ocean and consume mostly mammals; and resident populations, that have smaller ranges and eat mostly fish.
Under the assumption that orcas have begun to use otters as a food source, Estes suggested the following chain of events leading to this behavioral change:
- Composition of fish species in the Bering Sea has changed dramatically in recent decades. Oily fish species such as ocean perch and herring have declined, while less oily fishes such as pollock have increased. Possible causes include:
- Overfishing
- Rising ocean temperatures in the northern Pacific
- Hunting of large plankton-feeding baleen whales,
which allowed plankton populations to increase.
This favors plankton-feeding fish, including pollock.
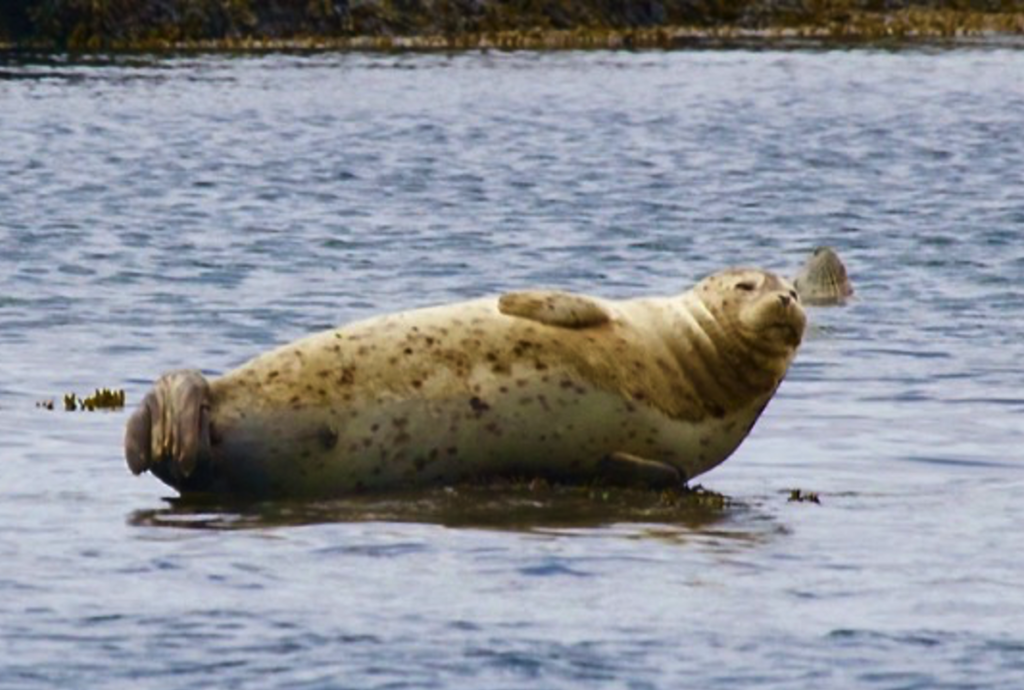
- The decline in oily fish is a likely contributor to the collapse of Steller sea lion and harbor seal populations in the North Pacific, which had declined by as much as 80 percent by 1990. While pollock are available as an alternate food source, they are not as nutritious, particularly for growing juvenile pinnipeds.
- Seals and sea lions are the major food source for transient orcas. Faced with a shortage of their normal prey, orcas may have switched to hunting otters, instead.
In addition to the trophic relationships we’ve explored up above, it turns out an even wider variety of organisms are affected by the collapse of kelp forest ecosystems. When otters are lost from a system:
- The growth rates of filter-feeding barnacles and mussels decline two- to threefold
- Population density of the rock greenling, a common kelp forest fish, declines approximately 10-fold
- The diet of glaucous-winged gulls shifts from fish to invertebrates
- The diet of bald eagles shifts from approximately equal parts fishes, birds, and mammals to domination by marine birds
- The density of starfish populations declines one to two orders of magnitude
- Reduced abundance of starfish, which are important predators in their own right, reduces the intensity of predation on invertebrates including the sea urchin.
When we consider that the loss of otters in kelp forests can cause a trophic cascade in those ecosystems that affects not only marine creatures, but birds as well, it becomes clear how complex and interconnected these feeding relationships are on a very large scale.
You will now revise your food web chart, to include the new development described in the article.
- Add this species to your matrix chart; in addition to adding orcas, you will need to add information to any species that are eaten by orcas
- Use this information to make any necessary changes to the food web chart (in particular, you will want to change the “Top Down” arrows)
- Submit your assignment as instructed by your lab instructor.
Navigation:
Landing page: https://wendystjohn.summerlark.net/2020/11/18/ecology-lab/
Ecosystem Exploration: https://wendystjohn.summerlark.net/2021/11/19/ecosystem-exploration-fairfield-osborn-preserve/
Trophic Interactions in the Kelp Forest: https://wendystjohn.summerlark.net/2020/11/24/trophic-interactions-in-the-kelp-forest/