Zombie Outbreak!
An epidemiologist studies the health of populations to discover what factors lead to disease. From their research epidemiologists communicate to the public information about the cause, spread, or threat of certain diseases. An investigation into a potential disease outbreak may follow the steps below:
1. Is it an outbreak? Is the disease common to the area or been reported in the area previously? It is considered an outbreak when the number of infections reported is higher than the expected number of infections.
2. Identify the specific nature of the disease, by reviewing symptoms and features of the illness. Visit people who became ill to gain a better understanding of the disease and those affected by it. You may be able to gather critical information by asking about their movements and interactions with other people who may also have the disease.
3. Determine the number of people infected and the risk factors, by examining the number of people who were exposed, where they were exposed, and over what period of time.
4. Create and test a hypothesis based on information on everyone infected along with specimens collected through field work. Diseases can be studied in this way by using cohort studies, which compare groups of people who have been exposed to risk factors with groups of people who have not been exposed. Disease can also be studied using case-control studies, where people with the disease are compared to people without the disease.
5. Determine control measures that can target the infection, the agent, the source, or the reservoir, and communicate these findings to local health authorities.
Let’s pretend that we are agents working with the Centers for Disease Control here in California, and a troubling situation has come to our intention. People have been going missing near Bakersfield, California, especially at night, and then reappearing a few days later as slow-moving, extremely strong perpetrators. They are constantly hungry, and attack at an alarming rate. They are also impervious to pain/injury and appear to be unaware of their surroundings. Researchers believe they are headed north.
In order to create a vaccine to stop the growing mass of those infected, we need to figure out how this virus originally infected the first victims. We know that all of the victims attended a carnival at the Kern County Fair. We have conducted interviews with a number of fairgoers, but haven’t had time to review them for consistencies. We need you to perform a thorough investigation.
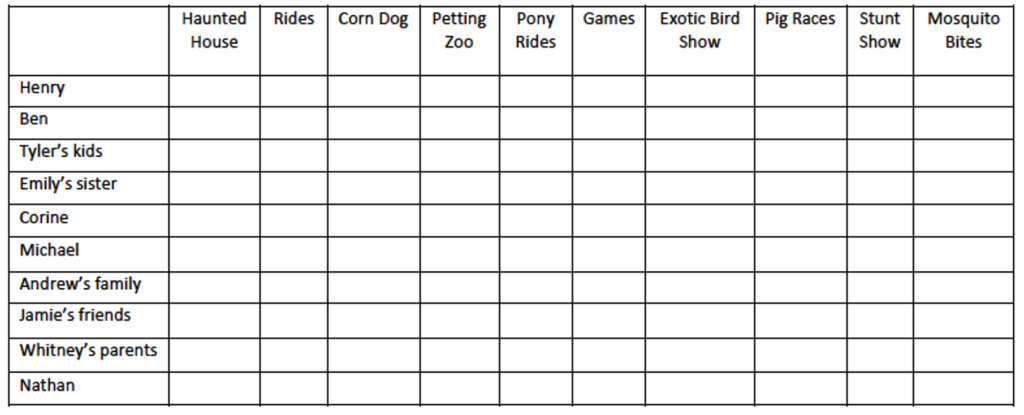
Listen to the interviews and fill out the chart below to evaluate the activities of anyone who later turned out to be infected.
Lauren:
Emily:
Tyler:
Ben:
Jamie:
Andrew:
Whitney:
Nathan:
Corine:
Michael:

- Based on the interviews, what have you identified as the source of the outbreak?
Follow-up questions:
- Think about modes of transmission. How would the spread of a disease differ if the pathogen is airborne, foodborne, waterborne, requires physical contact like a handshake, or intimate contact like sex, or a kiss? Which types of diseases would probably spread more quickly? More slowly? Be transmitted between strangers, or between people who know one another?
- Which would be the most deadly mode of transmission if a terrorist was trying to intentionally create an epidemic? Why?
- Why does international air travel increase the risk of a rapidly spreading pandemic?
- Why are schools, restaurants, movie theaters, and shopping malls likely locations for a disease to spread?
- Many diseases, such as the common cold, don’t have visible symptoms during their most infectious stage. How does this affect their transmission?
- Describe a situation where certain people (the old, the young, the immune compromised) are more “at risk” than others to a disease. Why isn’t everybody equally susceptible?
- Why does getting vaccinated protect people who are too young or otherwise unable to get vaccinated?
Vaccines
Answer the questions in your worksheet as you watch “The Side Effects of Vaccines.”
- What are the basic principles of vaccine use?
- How many cases of measles were recorded in each year of the 1950s?
- True or false: It has been scientifically proven that vaccines cause autism.
- How many people died from the measles in 2017?
Activity 4: Flattening the Curve
As we have gone through the COVID-19 pandemic, you may have heard the term “Flattening the Curve.” This has been one of the goals of the precautions we are taking – social distancing, wearing masks, avoiding crowds of people. But what does this mean? In this activity, we will explore “flattening the curve,” but first, we need to understand some ideas about how populations can grow over time, depending on the available resources.
Exponential & logistic growth
How do populations grow when they have unlimited resources?
- In exponential growth, a population’s per capita (per individual) growth rate stays the same regardless of population size, making the population grow faster and faster as it gets larger.
- In nature, populations may grow exponentially for some period, but they will ultimately be limited by resource availability.
- In logistic growth, a population’s per capita growth rate gets smaller and smaller as population size approaches a maximum imposed by limited resources in the environment, known as the carrying capacity.
- Exponential growth produces a J-shaped curve, while logistic growth produces an S-shaped curve.
In theory, any kind of organism could take over the Earth just by reproducing. For instance, imagine that we started with a single pair of male and female rabbits. If these rabbits and their descendants reproduced at top speed (“like bunnies”) for 777 years, without any deaths, we would have enough rabbits to cover the entire state of Rhode Island. And that’s not even so impressive – if we used E. coli bacteria instead, we could start with just one bacterium and have enough bacteria to cover the Earth with a 111-foot layer in just 363636 hours!
As you’ve probably noticed, there isn’t a 111-foot layer of bacteria covering the entire Earth (at least, not at my house), nor have bunnies taken possession of Rhode Island. Why, then, don’t we see these populations getting as big as they theoretically could? E. coli, rabbits, and all living organisms need specific resources, such as nutrients and suitable environments, in order to survive and reproduce. These resources aren’t unlimited, and a population can only reach a size that match the availability of resources in its local environment. Population ecologists use a variety of mathematical methods to model population dynamics (how populations change in size and composition over time). Some of these models represent growth without environmental constraints, while others include “ceilings” determined by limited resources. Mathematical models of populations can be used to accurately describe changes occurring in a population and, importantly, to predict future changes.
Exponential growth
Bacteria grown in the lab provide an excellent example of exponential growth. In exponential growth, the population’s growth rate increases over time, in proportion to the size of the population. And the results can be dramatic! Let’s take a look at how this works.
Bacteria reproduce by binary fission (splitting in half), and the time between divisions is about an hour for many bacterial species. What would happen if we start with a single bacterium in a flask with an unlimited supply of nutrients?
- After 1 hour: The bacterium will divide, resulting in 2 bacteria
- After 2 hours: 2 bacteria will divide, resulting in 4 bacteria
- After 3 hours: 4 bacteria will divide, resulting in 8 bacteria
If that pattern continues . . .
- After 4 hours: 16 bacteria
- After 5 hours: 32 bacteria
- After 6 hours: 64 bacteria
- After 7 hours: 128 bacteria
- After 8 hours: 256 bacteria
- After 9 hours: 512 bacteria
- After 10 hours: 1024 bacteria
- After 11 hours: 2048 bacteria
- After 12 hours: 4096 bacteria
- After 13 hours: 8192 bacteria
- After 14 hours: 16384 bacteria
- After 15 hours: 32768 bacteria
- After 16 hours: 65536 bacteria
- After 17 hours: 131072 bacteria
- After 18 hours: 262144 bacteria
- After 19 hours: 524288 bacteria
- After 20 hours: 1048576 bacteria
- After 21 hours: 2097152 bacteria
- After 22 hours: 4194304 bacteria
- After 23 hours: 8388608 bacteria
- After 24 hours: 16777216 bacteria
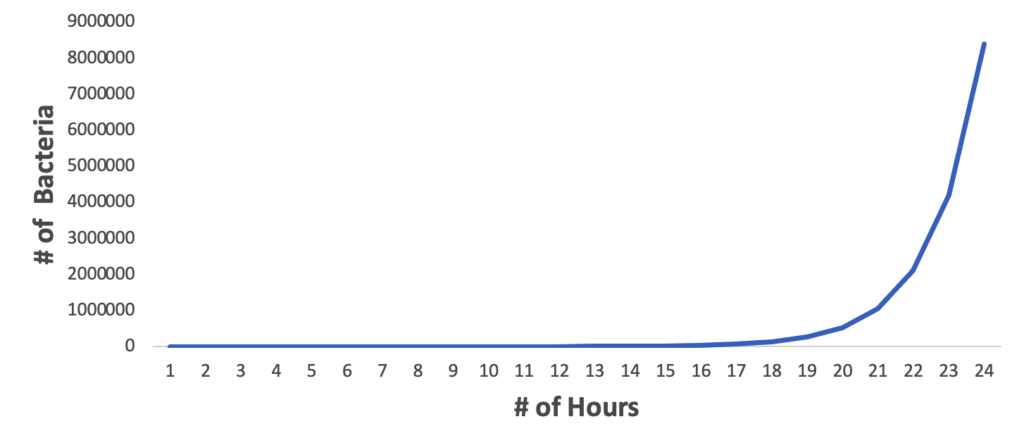
A graph of this bacterial growth makes a “J” shaped curve that is characteristic of exponential growth:

If these bacteria continued to grow with unlimited resources, the results would be even more dramatic. After one week (168 hours), the colony would have grown to 1.8707E+50 bacteria. That number is in scientific notation; if we write out all the zeros, we have:
187,070,000,000,000,000,000,000,000,000,000,000,000,000,000,000,000 bacteria
For comparison, there are currently about 7,800,000,000 people on the entire Earth.
Logistic growth
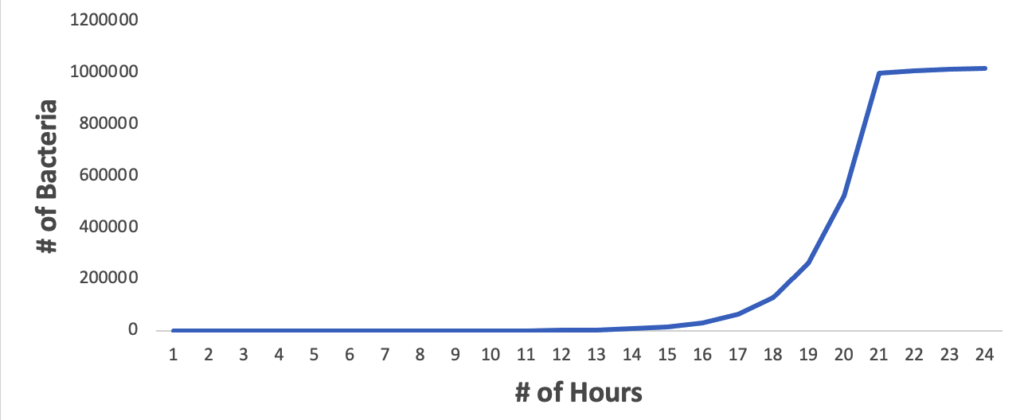
While that amount of growth might seem alarming, especially if all organisms were able to grow at an exponential rate, this pattern of growth is not a very sustainable state of affairs, since it depends on infinite amounts of resources (which tend not to exist in the real world). Instead, exponential growth may happen for a while, while there are few individuals and many resources. But when the number of individuals gets large enough, resources start to get used up, slowing the growth rate. Eventually, the growth rate will plateau, or level off, making an S-shaped curve. The population size at which it levels off, which represents the maximum population size a particular environment can support, is called the carrying capacity.
To return to our bacteria example, what would happen if there wasn’t an unlimited amount of resources in our flask, but we maintained the nutrients at a level that would support just 1,000,000 bacteria? At the beginning, the population would still grow very quickly, as it did in the first example. But as the population size begins to approach the maximum level of resources, that growth will level off:

What factors determine carrying capacity?
Basically, any kind of resource important to a species’ survival can act as a limit. For plants, the water, sunlight, nutrients, and the space to grow are some key resources. For animals, important resources include food, water, shelter, and nesting space. Limited quantities of these resources results in competition between members of the same population, or intraspecific competition (intra- = within; -specific = species). Intraspecific competition for resources may not affect populations that are well below their carrying capacity—resources are plentiful and all individuals can obtain what they need. However, as population size increases, the competition intensifies. In addition, the accumulation of waste products can reduce an environment’s carrying capacity.
Text adapted from: https://www.khanacademy.org/science/biology/ecology/population-growth-and-regulation/a/exponential-logistic-growth
Flattening the Curve
Now, let’s apply these ideas about population growth to the SARS-CoV-2 virus – the pathogen that causes COVID-19. For a disease-causing agent, one limiting factor can be the availability of hosts – in this case, people who are vulnerable to infection by the virus. Flattening the curve refers to the effect that behavior changes and vaccination could have on reducing the transmission of the virus by limiting the number of opportunities for it to be transmitted from person to person.
Visit the interactive website linked below, and answer the questions in this section of the worksheet.
Access the interactive website here: https://www.washingtonpost.com/graphics/2020/world/corona-simulator/
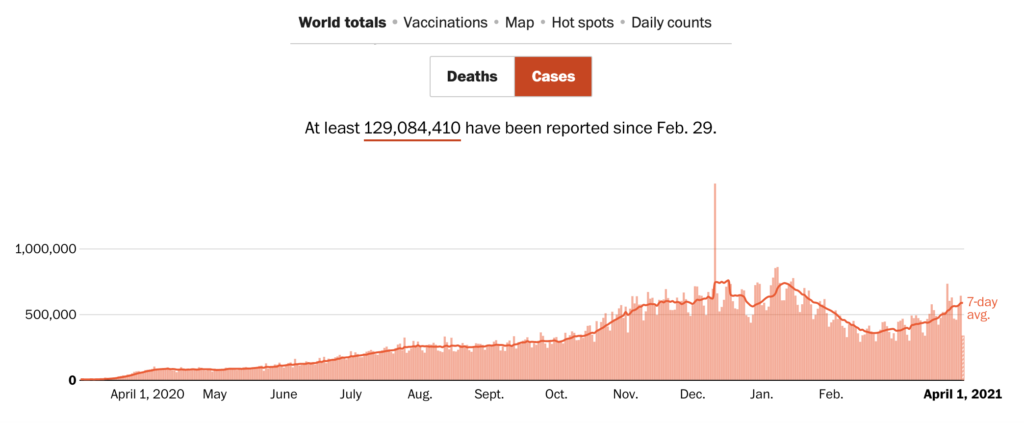
Consider the graph below, which shows the number of cases of COVID-19 over time.

- Based on this curve, does it appear that the spread of this virus represents exponential or logistic growth? Explain your answer.
The website says that, “In nature, populations may grow exponentially for some period, but they will ultimately be limited by resource availability.”
- What resources do you think COVID-19 needs in order to grow exponentially?
- How could those resources be limited?
- Run the simulation where “simulitis spreads in a town of 200 people.” Fill in the data table below, then draw the way the “Change over time” curve progressed over time:

- Now view the “forced quarantine” simulation. Fill in the data table and draw the curve.

- View the simulation where three-quarters of the population practices “social distancing.” Fill in the table and draw the curve.

- View the simulation where only 1 in 8 people are not practicing social distancing. Fill in the table and draw the curve.

- Based on the simulations you ran, explain in your own words how social distancing can help slow the progression of an infectious disease such as COVID-19.