This week and next week in lab we will explore the world of food webs, using data from two African national parks: Gorongosa National Park in Mozambique, and Serengeti National Park in Tanzania. Include your responses to all questions in your lab notebook. The worksheet linked below contains the questions that are presented below. You will need to create all graphs and tables in Excel and paste them into the notebook.
Introduction
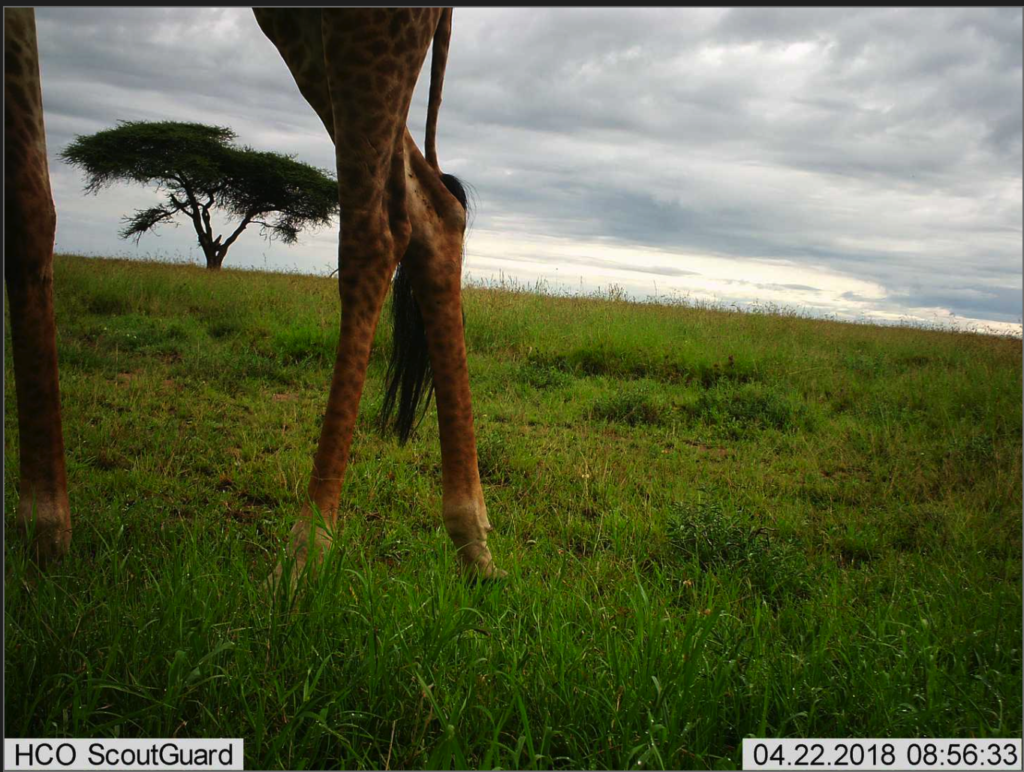
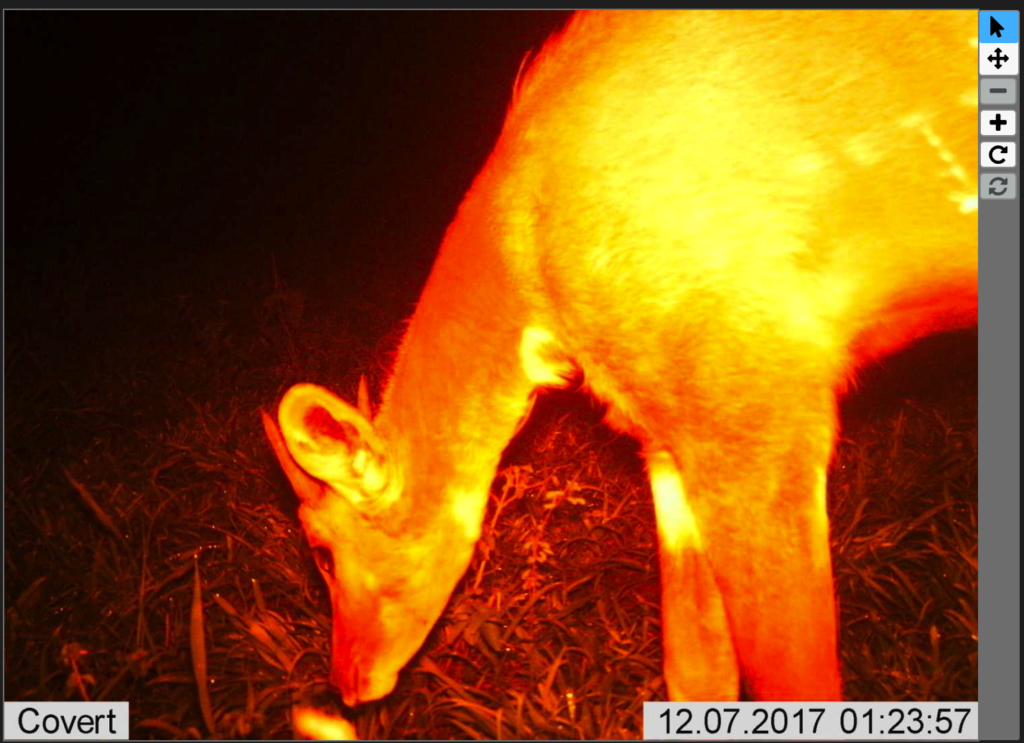
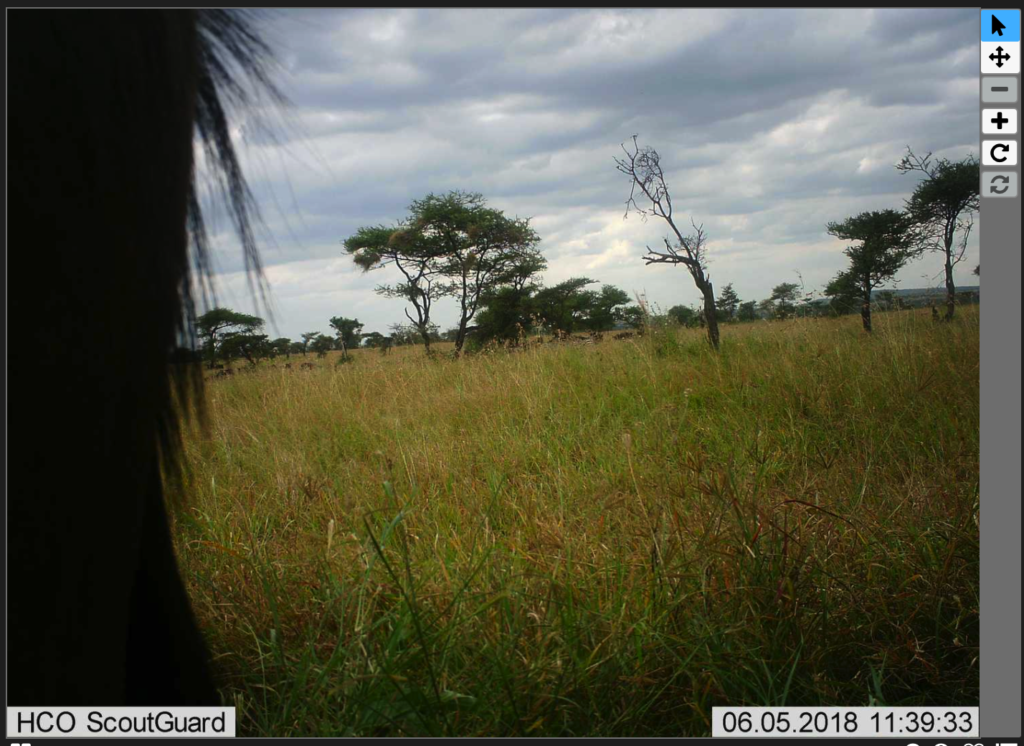
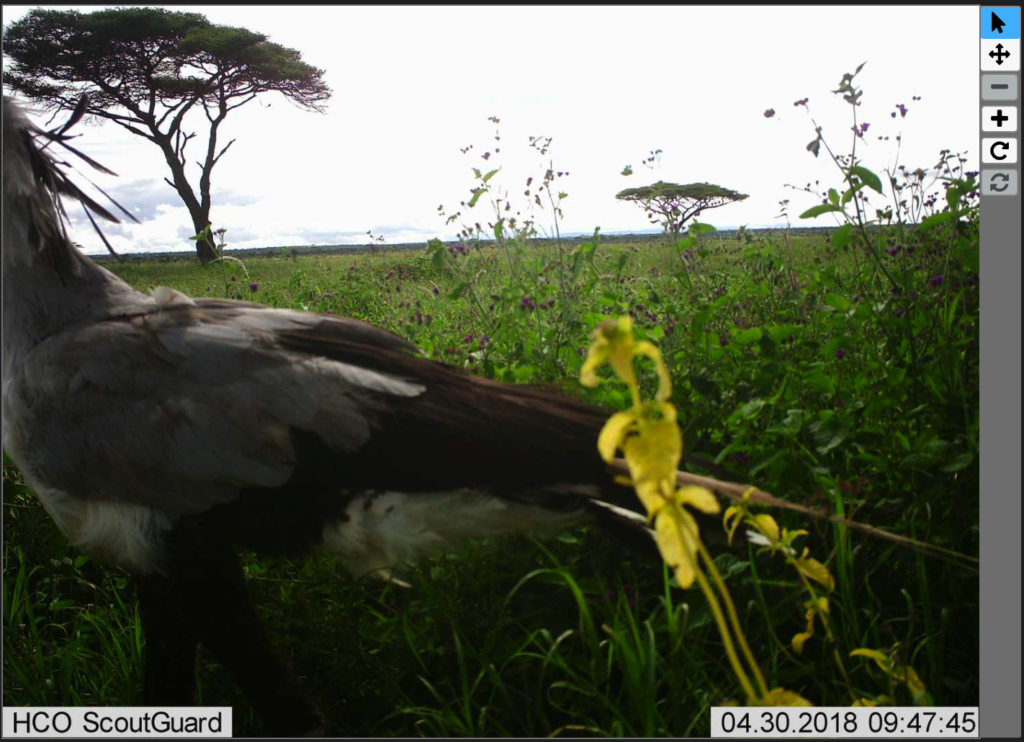
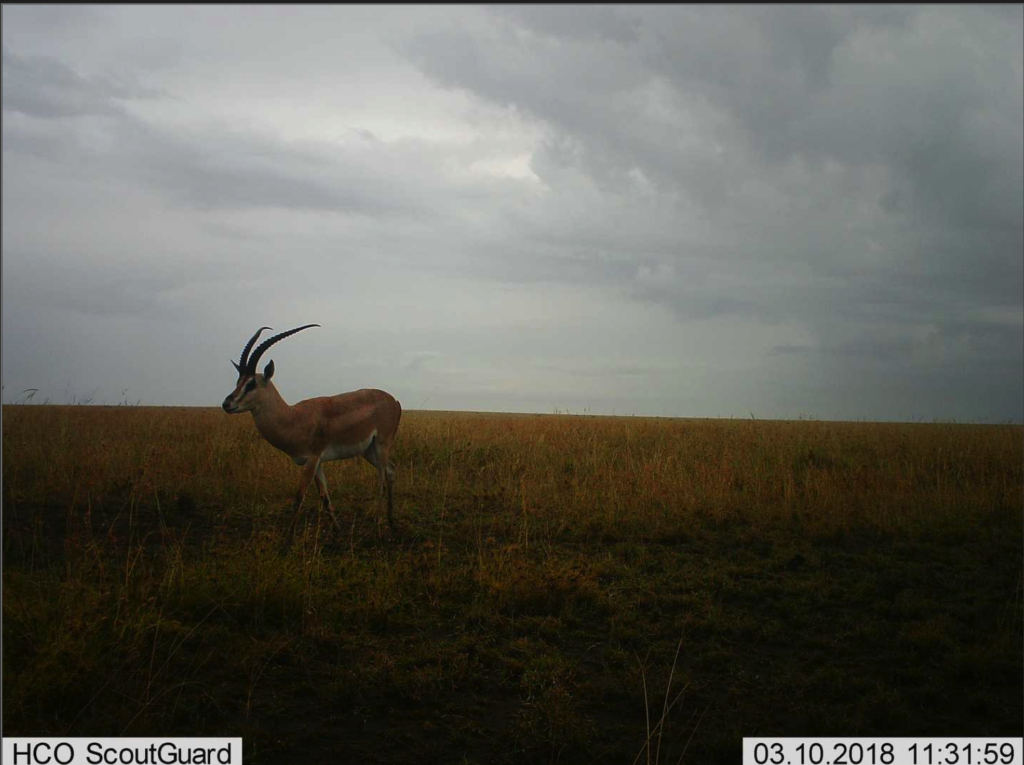
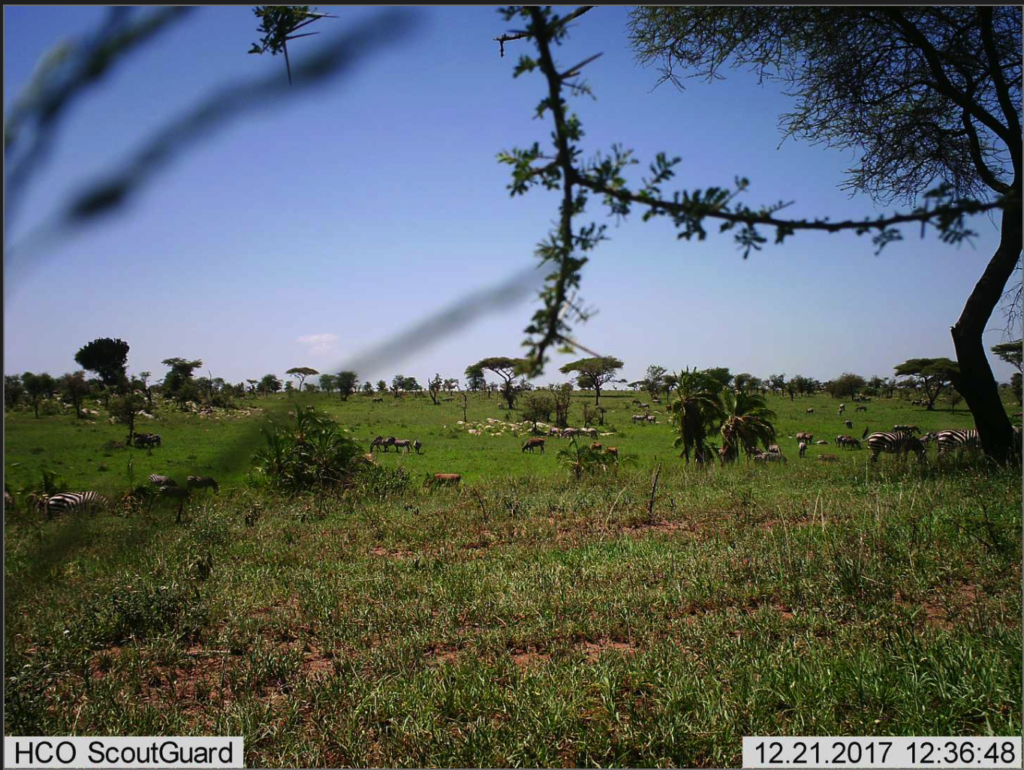
Gorongosa National Park is a 1,570-square-mile protected area in Mozambique. After several decades of war devastated Gorongosa’s wildlife populations, park scientists and conservation managers are now working to restore the Gorongosa ecosystem and the wildlife that depend on it. Lion researcher Paola Bouley and her team use motion-detecting trail cameras to learn more about Gorongosa’s lions. Lions are not the only animals that are captured on these cameras.
Gorongosa National Park is home to wildebeests, elephants, zebras, and many other types of animals. These photos can provide valuable information for science and conservation in Gorongosa, such as the quantity and type of animals within ecosystems.
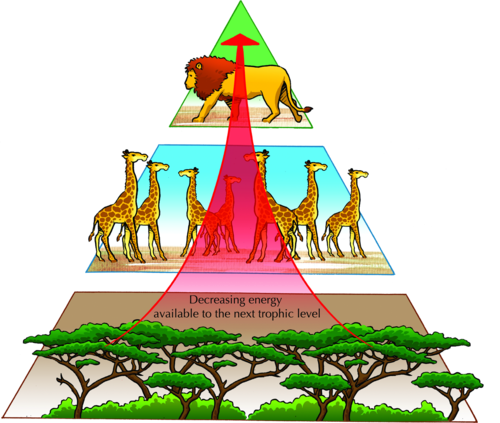
Scientists often depict this information in ecological pyramids, which are diagrams that show the relationships between trophic levels and the position of species among trophic levels. Trophic levels are the levels of a food chain where the organisms at higher positions eat those directly below them. The bottom level is producers (usually plants), which are eaten by primary consumers, followed by secondary consumers, and so on. Ecological pyramids can represent a variety of relationships, such as the numbers of organisms (numbers pyramid), energy flow (energy pyramid), or biomass of organisms (biomass pyramid). A biomass pyramid is constructed by calculating the total mass, or weight, of all living organisms within each trophic level in an ecosystem.
In this activity, you will be an ecologist studying the structure of the trophic levels in grassland habitats in Africa. Using the trail camera photos, you will identify and make observations about the species present in this ecosystem. Then you will create a biomass pyramid showing the relationships among trophic levels within the grassland habitat.
Procedures and Questions
Follow the instructions below and complete the tasks in the spaces provided.
Part 1: Meet the Organisms
The first step in building an ecological pyramid is understanding the species and their interactions with one another in an ecosystem. The steps below will familiarize you with the species that will become the basis for your pyramid.
- The Gorongosa website is no longer accepting identification submissions, so instead we will assess photos at a different location: Serengeti National Park in Tanzania.
- Go to Snapshot Serengeti (https://www.zooniverse.org/projects/zooniverse/snapshot-serengeti/classify)
- Click on the “Snapshot Serengeti” button (below “Get Started”).

- Spend 20-30 minutes observing and identifying species in photos. As you work, record the name of the species, the number of individuals of each species that you identify, and any relevant observations or questions you have about the species you are identifying. We will be targeting grassland habitats, so only select species from grassland vegetation types.
- You can use the Field Guide feature of the website to help you identify animals.
- If there are three white circles below the photo, that means it was part of a three-photo series taken in rapid succession. You can view all three photos to get a better idea of the animals that were present, but make sure not to double-count the same individuals.
- You should attempt to identify every animal that is visible in the photograph. You can add multiple species to a single photo ID.
- If you are not sure about an identification, just make your best guess.
- You will need to identify at least 10 different species in order to complete the food pyramid assignment below. (This shouldn’t be too difficult).
When making predictions about the biomass pyramid, you may use the WildCam Field Guide (the tab on the right hand side of the page) for additional information about the species in grassland vegetation types.
In your lab notebook, record your observations and questions relative to the species you identified. Make sure you cover 2 or 3 trophic levels (herbivores and predators) that utilize grassland habitats.
Now you will gather information about the species you observed to create a biomass pyramid in order to answer the following questions:
- How does biomass differ between trophic levels within your vegetation type?
- How does the structure of the biomass pyramids differ across vegetation types?
- What do these patterns suggest about the stability of the trophic structures in African grasslands?
Part 2: Make a Prediction
When making predictions about the biomass pyramid, you may use the WildCam Field Guide (the tab on the right hand side of the page) for additional information about the species in grassland vegetation types.
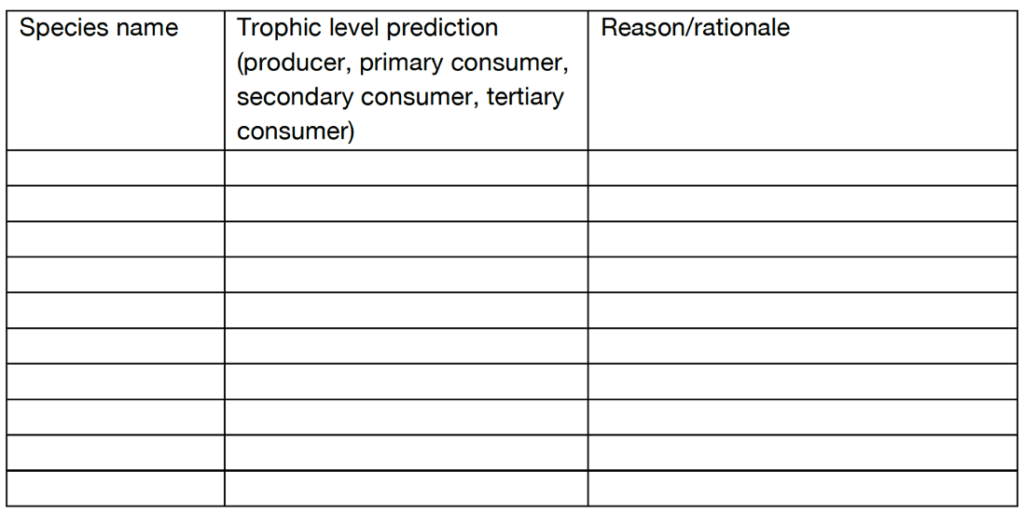
- Based on the animals you saw on WildCam, which species do you think will be at each trophic level for your grassland vegetation type? Why? (Note: you may not have tertiary consumers and you may have multiple species at each trophic level. All of the species in your photos should be listed. The easiest way to do this will probably be to create a table with your data.)
- Predict which trophic level will have the most biomass, based on your observations about each species for each trophic level.
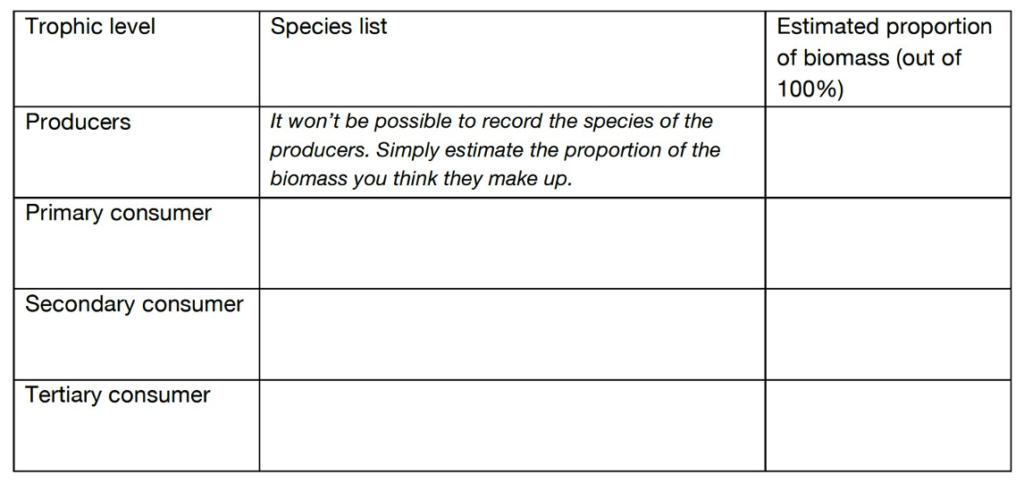
- Use your predictions in questions 2 and 3 to draw a biomass pyramid. Beginning with the producer level at the bottom, draw a horizontal bar for each trophic level. The width of the bars should match the proportion of biomass that you estimated in question 3. Label the trophic levels and, at each level, list the species you observed and your predicted percent biomass.
Part 3: Formulate a Plan
Now that you have a better understanding of what a biomass pyramid represents, you will develop a plan for building a biomass pyramid. Trail camera images do not provide enough information for you to estimate the biomass of the producer level. For now, you will focus on the consumer levels, and you will learn how to estimate producer biomass in part 5.
- In 1-2 sentences below list information you will need to calculate the biomass of each trophic level within grassland vegetation types.
Part 4: Analyze Your Data
To build a biomass pyramid, you typically begin by estimating the number of individual animals of each species. This variable, the number of individuals per species in a given area, is known as species abundance. Because trail cameras cannot provide us with a completely accurate measure of species abundance, we will use “intensity of use” as a proxy for “species abundance.” Intensity of use is a measure of how many photos were taken of each species over a set period of time. Thus, you can use intensity of use to calculate the relative biomass of each species in your vegetation type. Note: most of the species have biomass in the field guide tab, but some don’t; you may look up these species on Wikipedia or another internet source. .
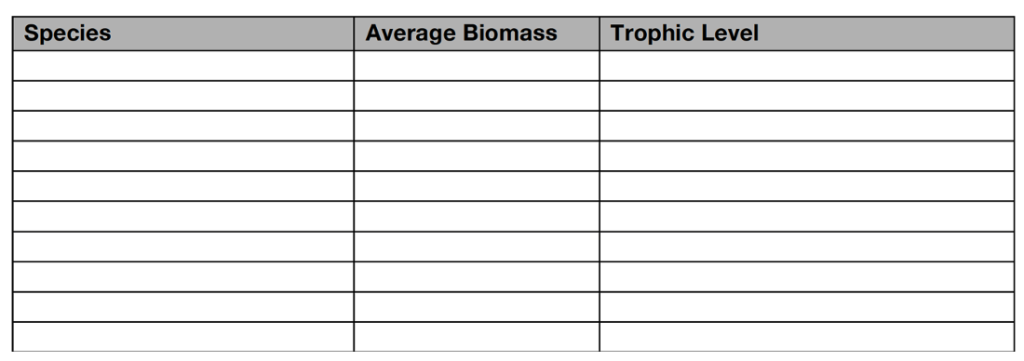
Record the species you identified in a table similar to the one below. Next, determine the average biomass and trophic level of each species. When using a source where biomass (weight) is reported as a range, record the mid-pont value. Depending on the vegetation type you were assigned, you may or may not find any tertiary consumers.
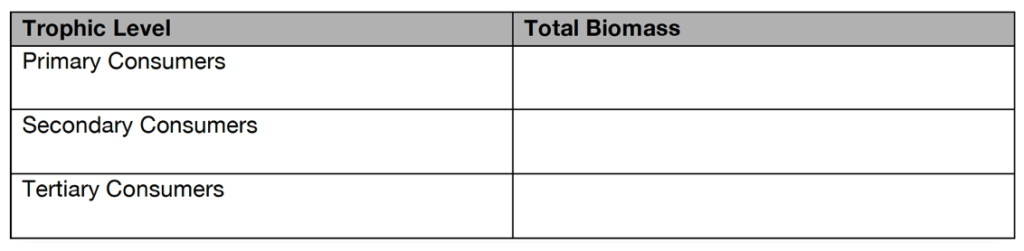
Now calculate the total biomass for each trophic level. We are going to assume that the sample area is 1 hectare (ha), and the abundance for all: Primary Consumers = 100 individuals per ha, Secondary Consumers = 20 individuals per hectare, and Tertiary Consumers = 3 individuals per ha.
Part 5: Estimate Producer Biomass & Build the Pyramid
Trail camera photos don’t provide you with the information you need to calculate producer biomass. Because of this, you must turn to the 10% rule to help estimate the producer biomass. The 10% rule refers to the phenomenon that approximately 10% of the energy of an organism in one trophic level is passed on to the trophic level above it when it is consumed. The remaining 90% is used in cell respiration or lost as heat. For example, if the producers contain 1000 kcal of energy, the primary consumers will only get 100 kcal of energy (10%) from the producers they eat. Because of this, the biomass required to support each trophic level isaffected by the 10% rule.
- Based on the consumer biomass, calculate producer biomass: _____________________ kg.
- Now you have the information you need to begin building your biomass pyramid.
- Using MS Excel, create a figure that shows Primary producer, Primary consumer, Secondary consumer, and Tertiary consumer (if present).
- Make sure this is presented in a stacked design, similar to a food pyramid. Include this graph in your lab notebook.
Part 6: Biomass Ratio
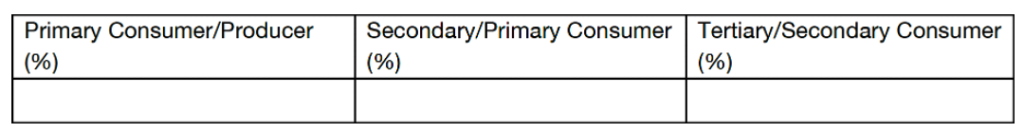
- Calculate the ratio of the biomass between each trophic level. Use the table below to organize your calculations.
- Compare the biomass ratios between the trophic levels. How do these ratios compare to the 10% rule? What is a possible explanation for this?
Part 7: Ecosystem Stability
- Analyze the biomass pyramid you have created. What observations and trends do you notice within your pyramid between the different trophic levels?
- Compare the pyramid you created with the original prediction you made in question 4. What similarities and differences do you notice between your actual pyramid and your prediction? Explain why there were differences.
- What can you conclude about the stability of the ecosystem based on the shape of your pyramid?
- Why do you think a pyramid shape is indicative of a stable ecosystem in terms of representing biomass across trophic levels?
- From what you know about how trail cameras collect data, what are some of the potential biases with this type of data? How might that impact your biomass pyramid?